Figure 2.
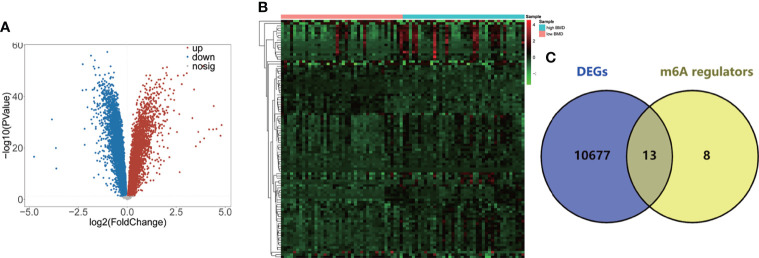
Identification of the 13 DE-m6A regulators. (A) Volcano plot showing the DEGs between high-BMD women (n = 40) and low-BMD women (n = 40) in the GSE56815 dataset. (B) Heatmap indicating the top 100 DEGs between high-BMD women (n = 40) and low-BMD women (n = 40) in the GSE56815 dataset. (C) Venn plot showing the DE-m6A regulators between high-BMD women (n = 40) and low-BMD women (n = 40) in the GSE56815 dataset.

