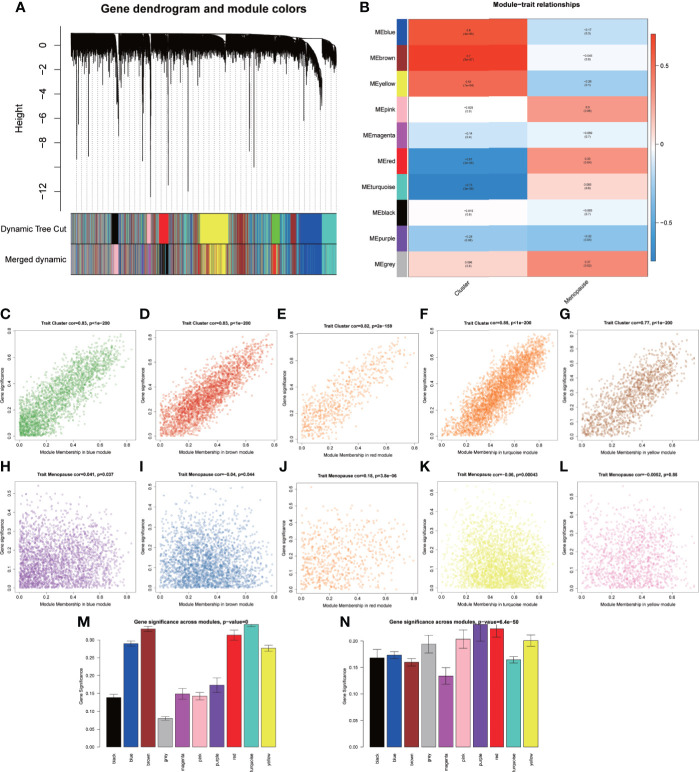
Figure 5.
Identification of the OP-related modules by WGCNA. (A) Clustering dendrogram of genes based on the measurement of dissimilarity (1-TOM) together with the assigned module colors. (B) Heatmap showing the correlation between the module eigengenes and clinical traits of OP. (C–G) Scatterplots showing the correlation between the MM and GS in each module (MEblue, MEbrown, MEyellow, MEred, and MEturquoise). (H–L) Scatter plots showing the correlation between the MM and clinical trait (menopause) in each module (MEblue, MEbrown, MEyellow, MEred, and MEturquoise). (M) Bar charts showing the correlation between GS and cluster trait in each module (MEblue, MEbrown, MEyellow, MEred, and MEturquoise). (N) Bar charts showing the correlation between GS and clinical trait (menopause) in each module (MEblue, MEbrown, MEyellow, MEred, and MEturquoise).

