Figure 8.
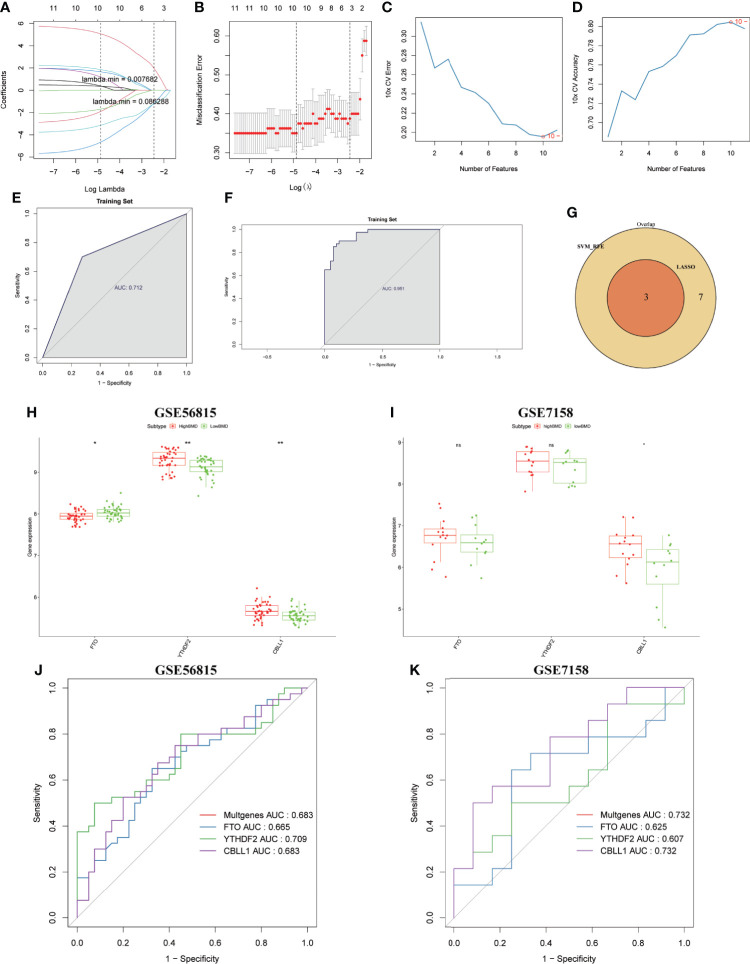
Identification and validation of the diagnostic markers for OP. (A) LASSO regression coefficient profiles of the 13 m6A regulators. Each curve represents the changing trajectory of each m6A regulator. (B) Tenfold cross-validation for optimal parameter selection in the LASSO model. Each red dot represents a lambda value with a confidence interval. The two dotted lines represent the values at minimum criteria and 1-standard error (1-SE) criteria by 10-fold cross-validation. The x-axis shows the penalization coefficient (log λ). The y-axis shows the partial likelihood deviance values with error bars. (C) The curve of the total within sum of squared error curve under corresponding cluster number k, and it reached the “elbow point” when k = 10. (D) The curve of average silhouette width under corresponding cluster number k, and the maximum of average silhouette width was achieved when k = 10. (E, F) ROC curves validated the performances of the LASSO regression model and the SVM-RFE model. (G) Venn plots show the candidate genes by overlapping the candidate genes selected from the LASSO regression model and the SVM-RFE model. (H, I) Boxplots showing the three differentially expressed m6A regulators (FTO, YTHDF2, and CBLL1) between high-BMD women and low-BMD women in GSE56815 and GSE7158 datasets. (J, K) ROC curves validated the performances of three m6A regulators (FTO, YTHDF2, and CBLL1) for the prediction of OP in GSE56815 and GSE7158 datasets.

