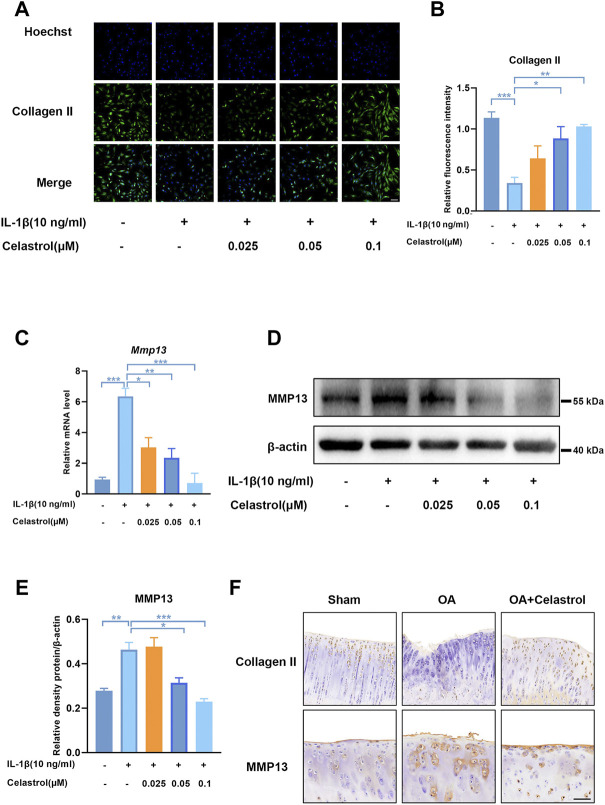
FIGURE 4.
Celastrol inhibited matrix degradation in rat chondrocytes. (A) Representative immunofluorescence staining for Collagen Ⅱ in rat chondrocytes (green: Collagen Ⅱ, blue: DAPI, scale bar:100 μm). (B) Quantification of the immunohistochemical staining data from A. (C) The mRNA levels of MMP13 in rCHs were assayed by real-time PCR. (D) Representative Western blot results for MMP13 in rCHs treated as indicated. (E) Quantification of Western blot data from D. (F) Immunohistochemical staining for CollagenⅡ and MMP13 in the affected joint cartilage of rats from different groups (scale bar:50 μm). All data represent mean ± S.E.M.*p < 0.05, **p < 0.01 and ***p < 0.001. All experiments were repeated 3 times.

