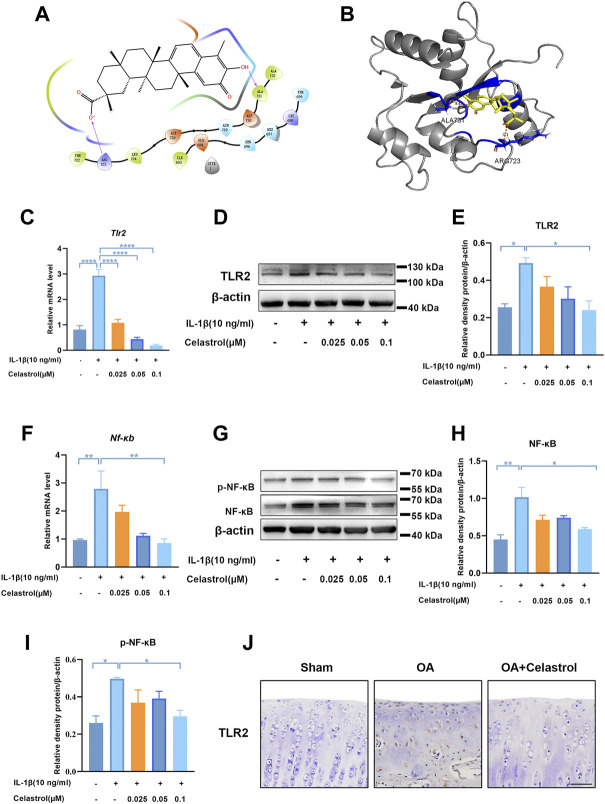
FIGURE 6.
Celastrol inhibited TLR2-triggered signals in rat chondrocytes. (A,B) Interaction diagrams of celastrol docked to TLR2 using Maestro software. (C,F) The mRNA levels of TLR2 and NF-κB in rat chondrocytes were assayed by real-time PCR. (D,G) Western blot results for TLR2, p-NF-κB and NF-κB in rat chondrocytes with or without celastrol. (E,H,I) Quantification of Western blot data from D and G. (J) Immunohistochemical staining for TLR2 in the affected joint cartilage of rats from different groups (scale bar: 50 μm). All data represent mean ± S.E.M. *p < 0.05, **p < 0.01, ***p < 0.001 and ****p < 0.0001. All experiments were repeated 3 times.

