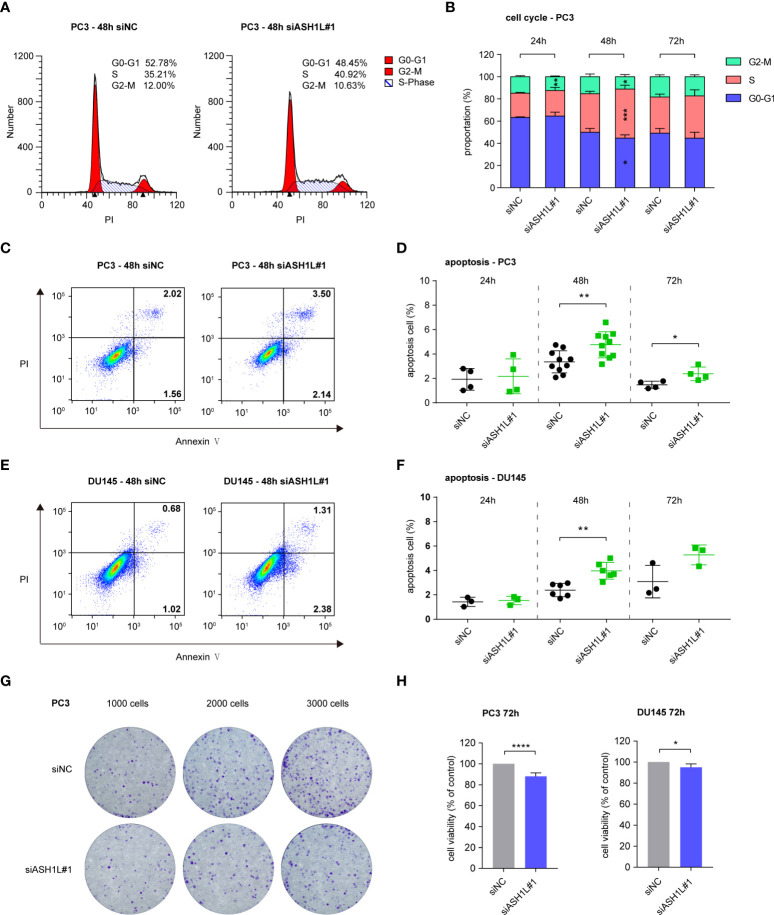
Figure 5.
ASH1L knockdown induced cell cycle arrest and apoptosis but did not affect cell viability. (A) Representative flow cytometry images about the cell cycle distribution of PC3 at 48 h after siNC and siASH1L#1 transfection. (B) Cell cycle analysis of PC3 at 24, 48, and 72 h after siNC and siASH1L#1 transfection. (C) Representative flow cytometry images showing the proportion of early apoptotic (Annexin V+ PI-) and late apoptotic (Annexin V+ PI+) PC3 cells at 48 h after siNC and siASH1L#1 transfection. (D) Apoptosis level of PC3 detected by Annexin V/PI staining at 24, 48, and 72 h after siNC and siASH1L#1 transfection. (E) Representative flow cytometry images showing the proportion of early apoptotic (Annexin V+ PI-) and late apoptotic (Annexin V+ PI+) DU145 cells at 48 h after siNC and siASH1L#1 transfection. (F) Apoptosis level of DU145 detected by Annexin V/PI staining at 24, 48, and 72 h after siNC and siASH1L#1 transfection. (G) Plate colony formation was performed in PC3 cells transfected with siNC and siASH1L#1 and incubated for 9 days. Representative colony images are shown. (H) Analysis of cell viability by the MTT assay in siNC- and siASH1L#1-transfected PC3 cells. The plates were detected at 72 h after siNC and siASH1L#1 were transfected. (These experiments were repeated at least three times, and the error bars represent at least three replicates. *, p < 0.05, **, p < 0.01, ****, p < 0.0001).

