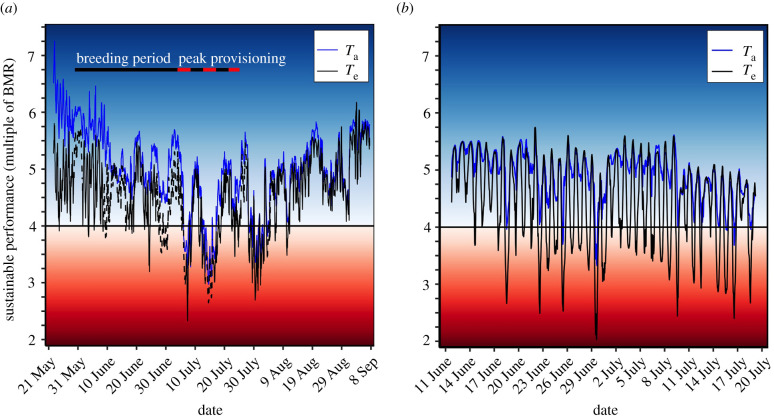
Figure 3.
Estimated sustainable performance possible for snow buntings (Plectrophenax nivalis) maintaining thermal balance at a (a) high-Arctic and (b) low-Arctic breeding site. The transition into the blue zone represents the times when average hourly operative (Te) or air (Ta) temperature was below the thermoregulatory polygon threshold temperature of 11.7°C, predicting that buntings could sustain performance levels ≥ four-time BMR without altering behaviour. The transition into the red zone represents the times when Te or Ta exceeded 11.7°C, predicting that buntings would be required to reduce their provisioning behaviour and work below four-time BMR to limit heat production and avoid overheating. Note that the darker the blue colour, the colder the recorded operative temperatures and the darker the red colour, the hotter the operative temperatures. The dashed black lines in (a) represent the predicted Te values from the artificial neural network (see methods for details). (Online version in colour.)

