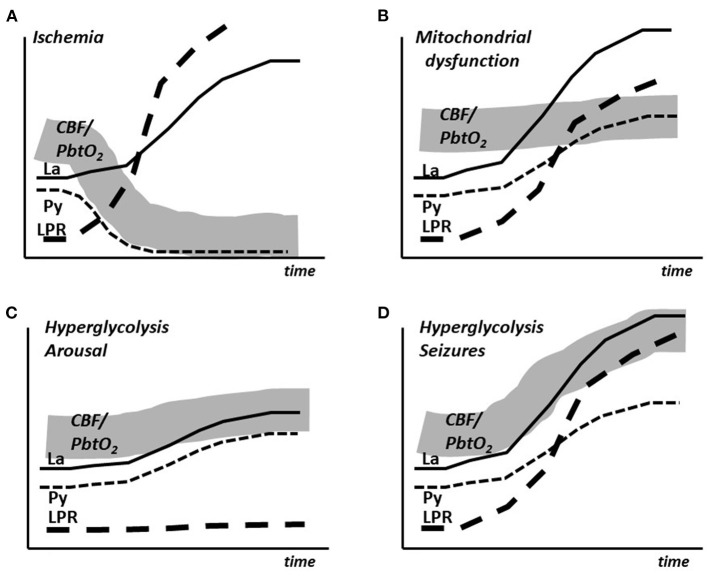
Figure 3.
Schematic illustration of the simultaneous changes in cerebral blood flow (CBF), brain tissue oxygen tension (PbtO2) and the intracerebral levels of lactate (La), pyruvate (Py) and lactate/pyruvate ratio (LPR) in cerebral ischemia (A), mitochondrial dysfunction (B), arousal (C) and epileptic seizures (D).

