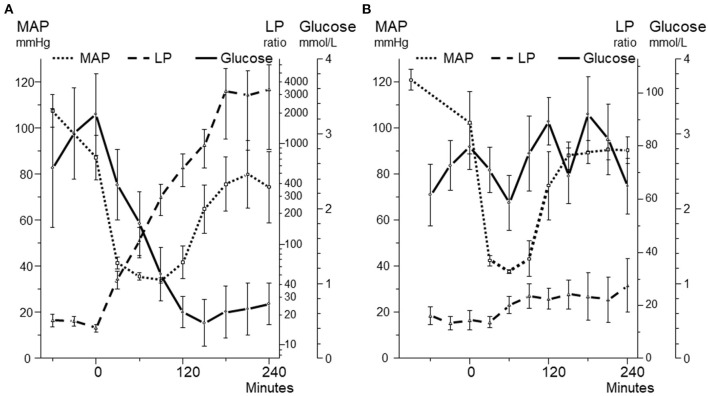
Figure 9.
Mean arterial blood pressure (MAP) and intracerebral levels of glucose and lactate/pyruvate (LP) ratio during 240 min before, during and after a 90 min period (A) and a 60 min period (B) of hemorrhagic shock. In both panels MAP decreased to 40 mmHg. Panel A illustrates the biochemical pattern during severe cerebral ischemia. Panel B illustrates a pattern when intracerebral glucose an LP ratio are relatively unaffected during a similar but shorter decrease in MAP. Data from (94, 95) are shown as Mean ± SEM.

