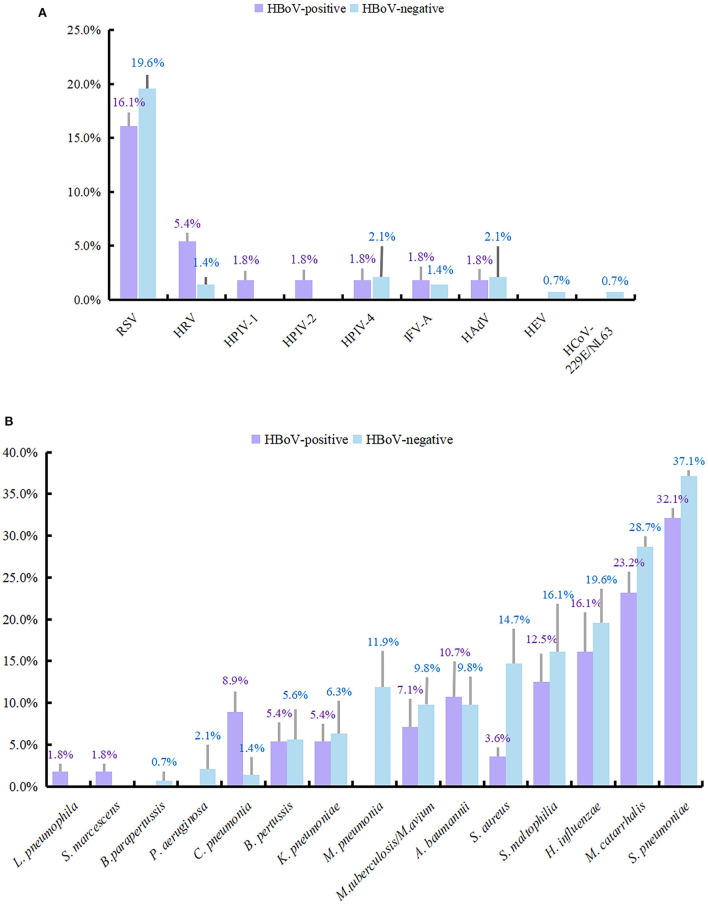
Figure 2.
Detection rate of viruses and bacteria in HBoV-infected group and uninfected group. The length of the color bar and the following number indicate the detection rate of each pathogen, with its positive number as the numerator and the number of people in each group as the denominator. (A) The detection rate of viruses. (B) The detection rate of bacteria.

