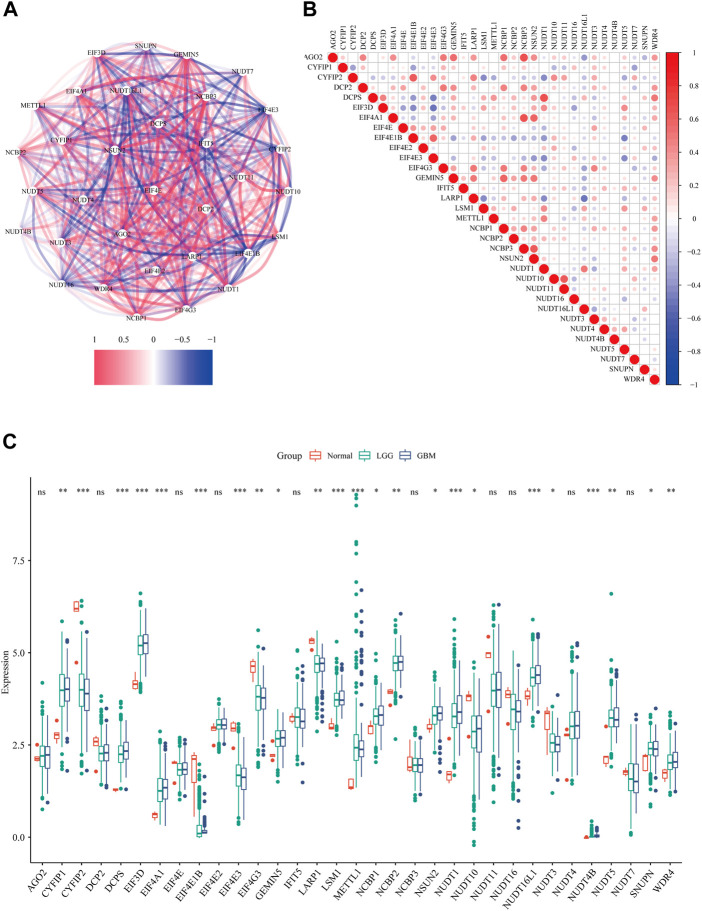
FIGURE 1.
The expression profile of m7G regulators in glioma. (A) The correlations network of 33 m7G regulators (red lines represent positive correlation and blue lines represent negative correlation, the darkness of color represents the strength of correlation). (B) The correlation heatmap of 33 m7G regulators (red dots represent positive correlation and blue dots represent negative correlation, the darkness of color represents the strength of correlation). (C) The expression levels of m7G-related genes among normal tissue, GBM and LGG (Kruskal-Wallis test, *p < 0.05; **p < 0.01; ***p < 0.001)

