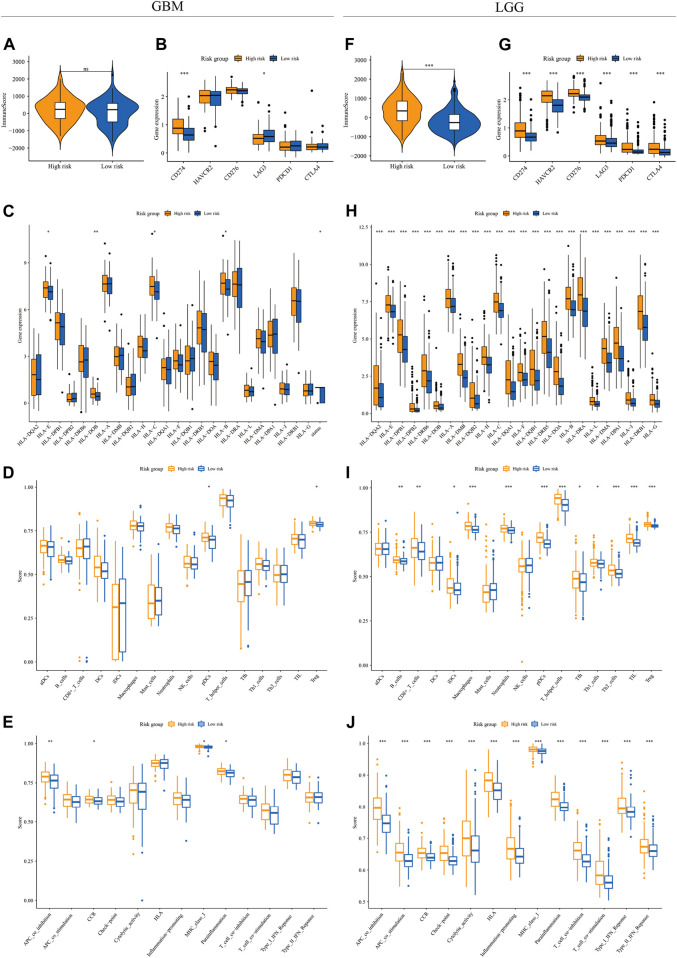
FIGURE 4.
The immune landscape in GBM and LGG subgroups. The violin plot and boxplots showed the immune score (A,F), expression level of immune checkpoint genes (B,G) and HLA genes (C,H), infiltration level of various immune cell types (D,I), and activity of immune functions (E,J) between high-risk (yellow) and low-risk groups (blue) in the GBM (A–E) and LGG (F–J) cohorts (Wilcox test, *p < 0.05; **p < 0.01; ***p < 0.001)

