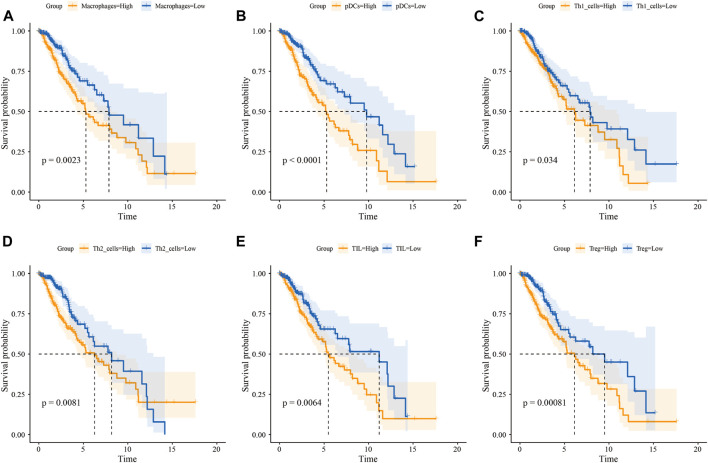
FIGURE 5.
Infiltration level of immune cells predicts OS of LGG patients. Kaplan-Meier survival curve for the OS of LGG patients subdivided by macrophage (A), pDC (B), Th1 cell (C), Th2 cell (D), TIL (E), and Treg (F) infiltration level (yellow lines represent high infiltration group and blue lines represent low infiltration group)

