Figure 6.
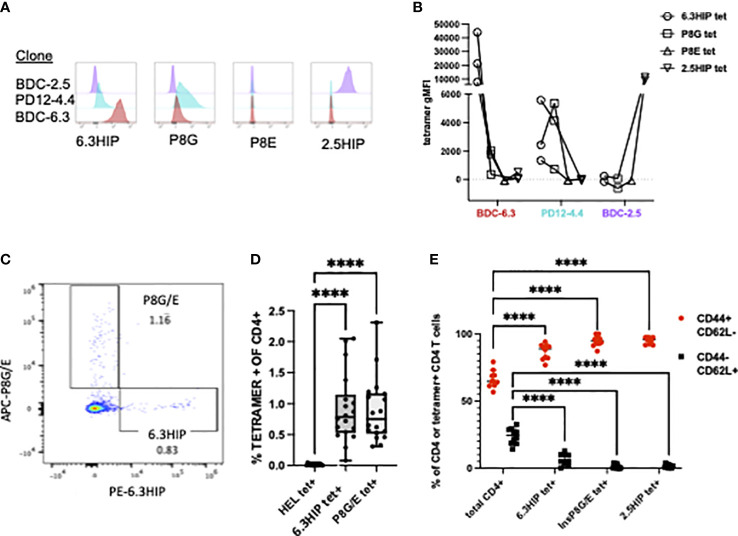
MHC Class II tetramer staining of CD4+ T cell clones and islet infiltrating CD4+ T cells. Representative histograms of (A) T cell clones BDC-2.5 (purple), PD12-4.4 (blue), and BDC-6.3 (red) stained with 6.3HIP, P8G, P8E, and 2.5HIP tetramers and the (B) geometric MFI from 2-3 experiments with lines connecting tetramer stains conducted on the same day. (C) Representative CD4 T cells from NOD islets stained with a mixture of I-Ag7 tetramers loaded with the P8G/E insulin mimotopes and 6.3HIP, and labeled with APC and PE, respectively. (D) Summary of results of the analysis of infiltrating CD4+ T cells from the islet isolations from a total of 18 NOD mice (5 separate islet isolations) stained with hen egg lysozyme (HEL), 6.3HIP and P8G/E tetramers. Data represented as percent of live lin- CD4+ T cells positive for each tetramer/animal and analyzed using a one-way ANOVA with Tukey’s multiple comparison test, (****P<0.0001) where the box defines the interquartile range, and the whiskers indicate minimum and maximum values. (E) Summary data (n=10) comparing the proportion of CD44+ and CD62L+ in total CD4 T cells or tetramer+ CD4 T cells within islets. A two-way ANOVA was used with Dunnett’s multiple comparison test to assess the antigen experience phenotype of CD4 T cells staining with each tetramer compared to the total CD4 infiltrate as a control (****P<0.0001). Gating strategy for tetramer staining of T cells is provided in Figure S2 .

