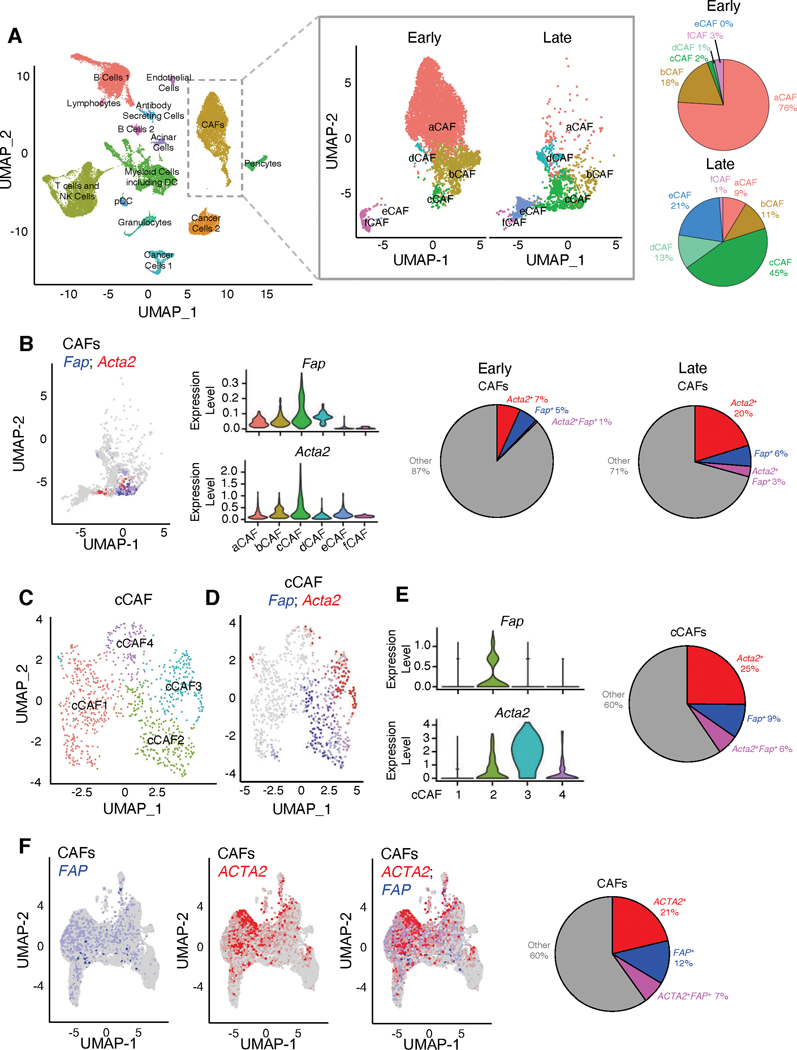
Figure 1. Distinct CAFs populations are identified by single-cell RNA-sequencing (scRNA-seq) in pancreatic tumors.
(A) UMAP projection of cell populations in KPC pancreatic tumors as determined by scRNA-seq (n=8 mice; 31,861 cells; left panel). UMAP projection of the digitally selected CAF cluster in early-stage and late-stage KPC mice (early-stage, n=5 mice, 6,018 cells; late-stage, n=3 mice, 1,606 cells; center panel). Percentages of CAF subsets in early-stage and late-stage KPC mice (right panel).
(B) UMAP projection (left panel) and violin plots (center panels) of Fap and Acta2 transcripts in late-stage KPC tumors (n=3 mice; 1,606 cells). Relative percentages of Fap+, Acta2+, and Acta2+Fap+ CAFs in early-stage (n=5 mice; 6,018 cells) and late-stage KPC tumors (right panel).
(C) UMAP projection of subpopulations of cCAF cluster identified in (B).
(D) UMAP projection (left panel) of Fap and Acta2 transcripts in cCAF cluster.
(E) Violin plots of Fap and Acta2 expression levels in cCAF subsets (left panels). Relative percentages of Fap+, Acta2+, and Acta2+Fap+ cCAFs (right panel).
(F) UMAP projections of FAP-expressing and ACTA2-expressing CAFs (left panel) and relative percentages of ACTA2+, FAP+, and ACTA2+FAP+ CAFs from human PDAC samples (right panel). scRNA-seq data from Peng et al. (31) was reanalyzed to overlay ACTA2-expressing and FAP-expressing CAFs. Fibroblast clusters were identified based on the expression of mesenchymal genes COL1A1, COL1A2, DCN and PDPN.

