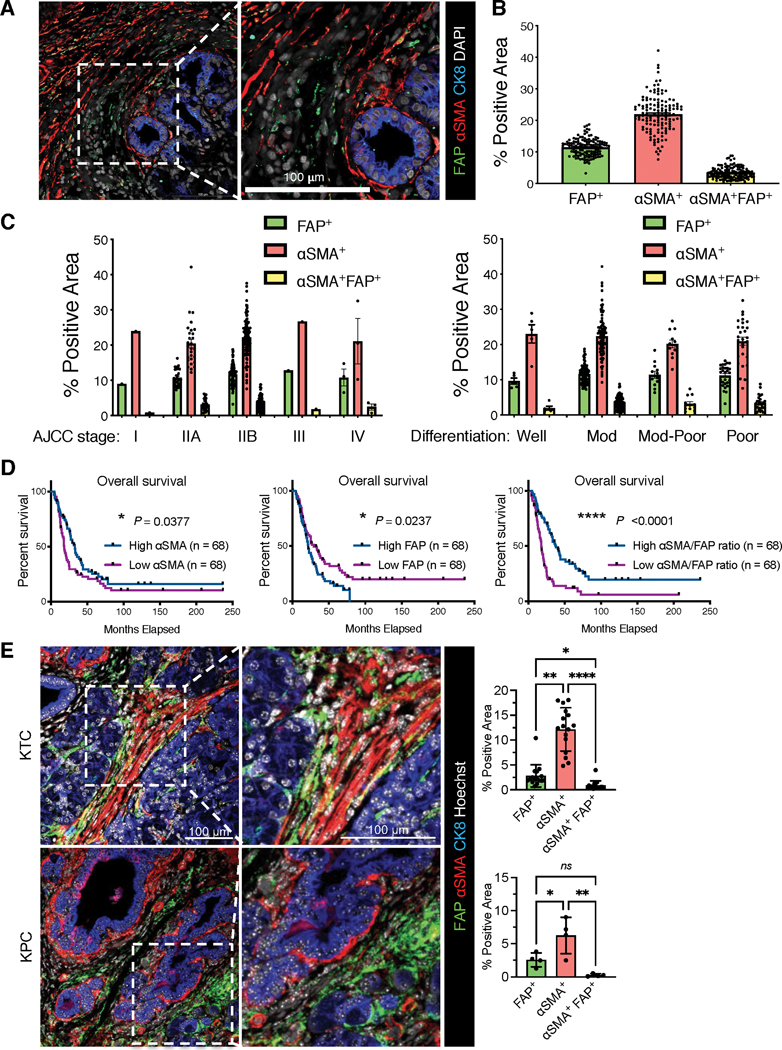
Figure 2. Distinct CAF subpopulations are identified by immunostaining in human pancreatic tumors.
(A-D) Human PDAC tissue microarray (TMA) of MDACC cohort with 136 cases were examined by FAP, αSMA, and cytokeratin-8 (CK8) immunofluorescence staining. (A) Representative image of FAP, αSMA, and cytokeratin-8 stained PDAC tissue (left panel). Scale bar: 100 μm. (B) The percentage of FAP+αSMA−, αSMA+FAP−, and αSMA+FAP+ positive area for all cases. (C) The percentages of FAP+αSMA−, αSMA+FAP−, and αSMA+FAP+ positive area in the subgroups with indicated AJCC stage (left panel). The percentages of FAP+αSMA−, αSMA+FAP−, and αSMA+FAP+ positive area in the subgroups with indicated tumor histology identities (right panel). (D) The comparison of overall survival between patient subgroups stratified by the values of FAP level, αSMA level, or αSMA/FAP ratio. Log rank Mantel-Cox test performed.
(E) The immunofluorescent staining of FAP and αSMA on pancreatic tumor tissue sections from KTC and KPC transgenic mouse models. Scale bar, 100 μm. KTC, n=16 mice; KPC, n=4 mice. Kruskall-Wallis with Dunn’s multiple comparison test performed for KTC tumors, one-way ANOVA with Tukey’s multiple comparison performed for KPC tumors. * p <0.05, ** p <0.01, **** p <0.0001, ns: not significant.

