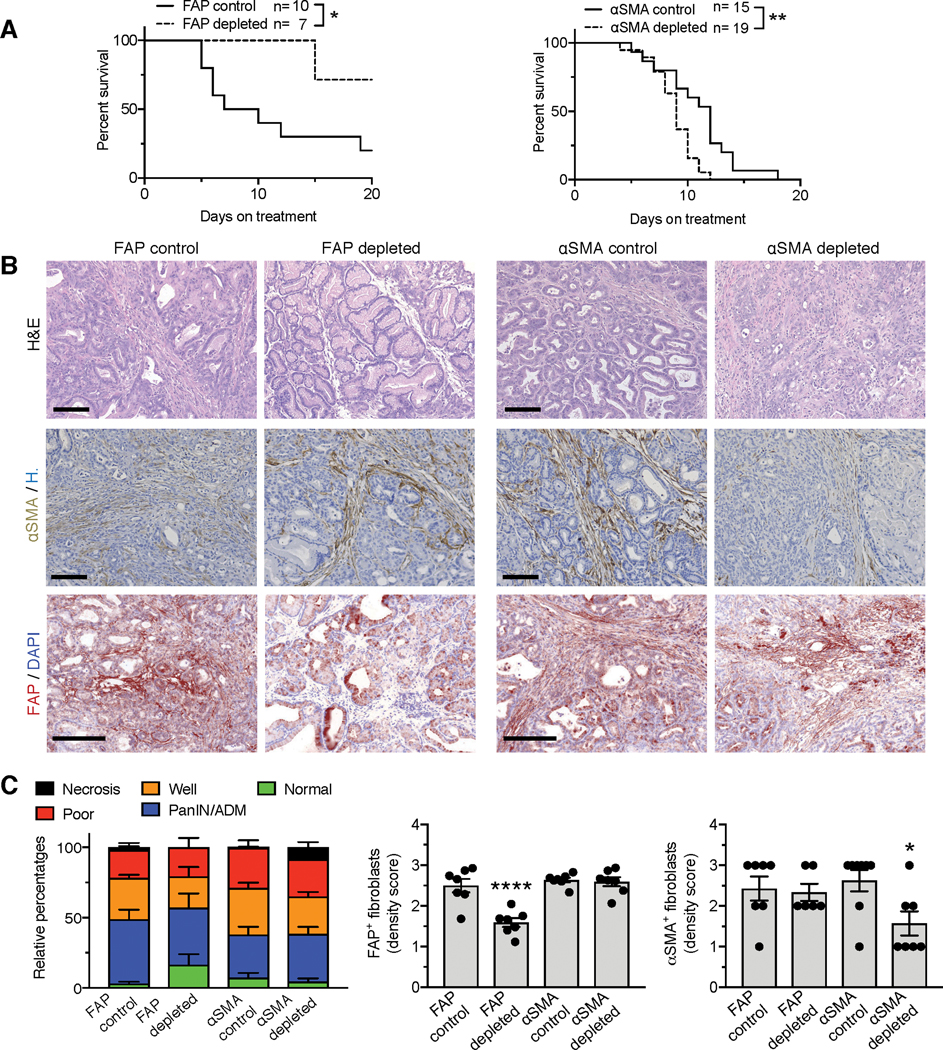
Figure 3. FAP+ CAFs and αSMA+ CAFs have opposing roles in PDAC progression.
(A) Survival curves of FAP-TK KTC mice and αSMA-TK KTC mice after start of treatment with GCV or PBS. FAP control, n=10; FAP depleted, n=7; αSMA control, n=15; αSMA depleted, n=19. Log rank Mantel-Cox test performed comparing the indicated groups.
(B) Representative micrographs of H&E (top panel), αSMA (middle panel) or FAP (bottom panel) immunostaining on control, FAP+ CAF-depleted, or αSMA+ CAF-depleted KTC pancreatic tumor sections. Scale bar: 100 μm.
(C) Relative percentages of each tumor histological phenotype (left panel). FAP control, n=7; FAP depleted, n=7; αSMA control, n=14; αSMA depleted, n=11. Quantification of FAP (middle panel) and αSMA (right panel) density scores in indicated groups of tumors. FAP scoring: n=7 mice per group. αSMA scoring: FAP control, n=7; FAP depleted, n=6; αSMA control, n=8; αSMA depleted, n=7. One-way ANOVA with Tukey’s multiple comparisons test was performed comparing control to depleted mice. * p < 0.05, ** p < 0.01, **** p < 0.0001.

