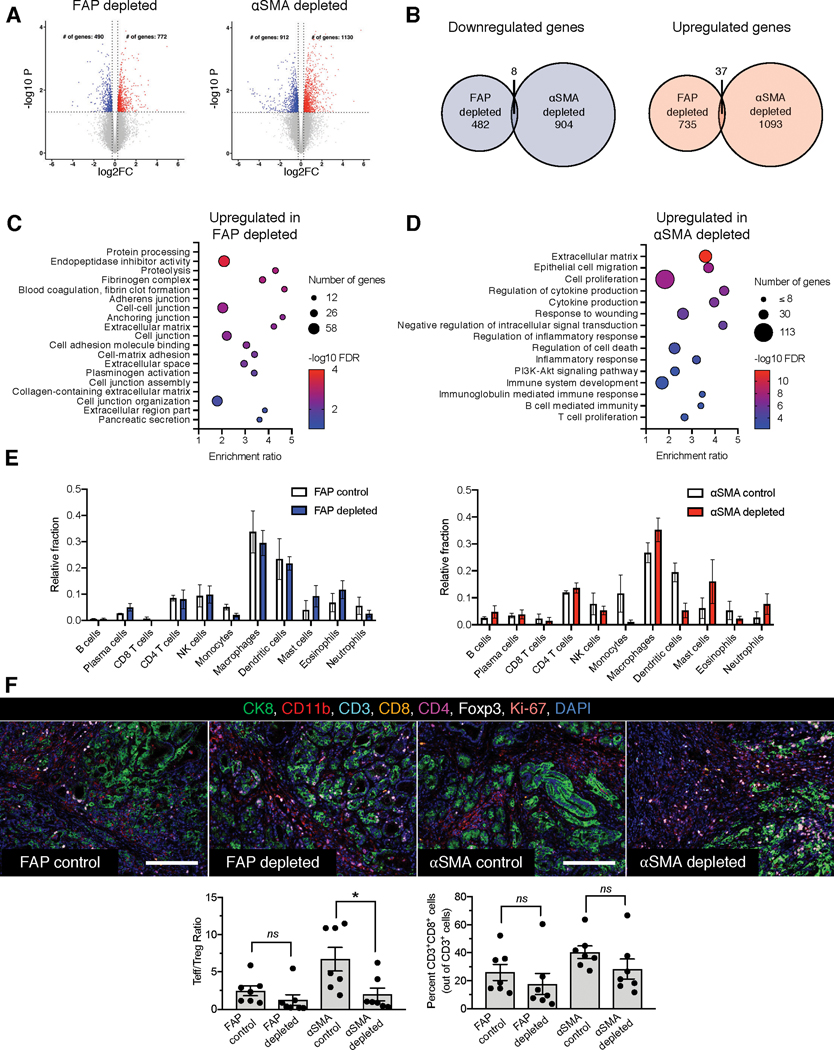
Figure 4. FAP+ and αSMA+ CAFs distinctly polarize the PDAC tumor immune microenvironment.
(A-B) Differentially regulated genes in endpoint FAP+ CAF-depleted and αSMA+ CAF-depleted KTC tumors. (A) Volcano plots of downregulated and upregulated genes in FAP+ CAF-depleted and αSMA+ CAF-depleted KTC tumors. n=3 mice per group. (B) Unique and common downregulated and upregulated genes in FAP+ CAF-depleted and αSMA+ CAF-depleted KTC tumors.
(C-D) GSEA pathways identified after depletion of FAP+ (C) or αSMA+ cells (D) from KTC tumors.
(E) CIBERSORT analysis of abundance of immune cell subsets in FAP+ CAF-depleted and αSMA+ CAF-depleted KTC tumors. n=3 mice per group.
(F) Multiplex immunohistochemical analysis of tumor immune infiltrate of endpoint FAP+ CAF-depleted and αSMA+ CAF-depleted KTC mice (top panel). Scale bar: 100μm. Quantification of Teff/Treg ratio (bottom left panel) and percent CD3+CD8+ cells (bottom right panel). n=7 mice per group. One-way ANOVA and unpaired two-tailed t-test performed comparing control to depleted mice. * p < 0.05, ns = not significant.

