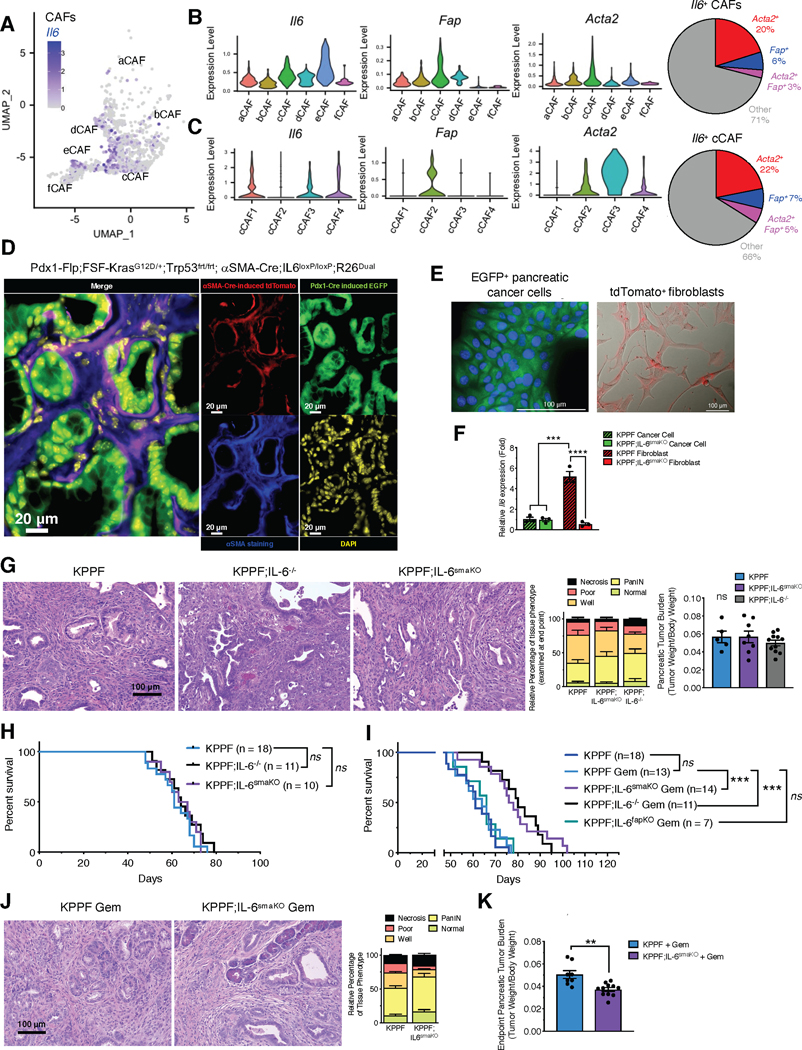
Figure 5. IL-6 produced by distinct CAFs populations in pancreatic cancer.
(A-C) The expression profile of Il6, Fap, and Acta2 of CAF populations from late-stage KPC pancreatic tumors, presented in UMAP projection (A), violin plots (B-C, left panels), and percentages (B-C, right panels) as determined by scRNA-seq originally shown in Figure 1.
(D) Representative fluorescence microscopic images of Pdx1-Flp-induced EGFP (green) expression, αSMA-Cre-induced tdTomato (red) expression, and αSMA immunofluorescence staining (blue) in the PDAC tissues of KPPF;IL-6smaKO;R26Dual mice. Scale bars, 20 μm.
(E) Representative fluorescence images of FACS isolated EGFP-expressing cancer cells and tdTomato-expressing αSMA+ CAFs (depleted for IL-6) from PDAC tissues of KPPF;IL-6smaKO;R26Dual mice shown in (D). Scale bars: 100 μm.
(F) qRT-PCR examination of IL-6 (Il6) in primary cancer cells and αSMA+ CAFs isolated from KPPF;IL-6smaKO;R26Dual mice (shown in E) and KPPF;αSMA-Cre;R26Dual mice (without IL-6 deletion in αSMA+ CAFs). Expression relative to Gapdh and KPPF cancer cells reported. n=3 biological replicates per group. One-way ANOVA with Sidak’s multiple comparisons test based on ΔCT values performed.
(G) Representative pancreatic sections with H&E staining of KPPF, KPPF;IL-6smaKO, and KPPF;IL-6−/− mice examined at endpoint (8–11 weeks of age, left panel), relative percentage of each histological tissue phenotype (center panel), and tumor burden (right panel). Scale bar: 100 μm. Histological phenotypes: KPPF, n=14; KPPF;IL-6smaKO, n=11; KPPF;IL-6−/−, n=11. Tumor burden: KPPF, n=5; KPPF;IL-6smaKO, n=8; KPPF;IL-6−/−, n=11. Two-way ANOVA (histological phenotypes) and one-way ANOVA (tumor burden) with Tukey’s multiple comparison test performed.
(H) Overall survival of KPPF (n=18), KPPF;IL-6smaKO (n=10), and KPPF;IL-6−/− (n=11) mice. Log rank Mantel-Cox test performed comparing the indicated groups.
(I) Overall survival of untreated KPPF (n=18, from Figure 5H) and KPPF (n=13), KPPF;IL-6smaKO (n=14), KPPF;IL-6−/− (n=11), and KPPF;IL-6fapKO (n=7) mice treated with gemcitabine (Gem). Log rank Mantel-Cox test performed comparing the indicated groups.
(J-K) Representative H&E sections of pancreatic tissues and relative percentage of each histological tissue phenotype (J), and pancreatic tumor burden (K) of gemcitabine-treated KPPF and KPPF;IL-6smaKO mice at endpoint. For (J): KPPF, n=6; KPPF;IL-6smaKO Gem, n=5. For (K): KPPF, n=8; KPPF;IL-6smaKO Gem, n=11. Scale bar: 100 μm. Two-way ANOVA with Sidak’s multiple comparison test performed for (J). Unpaired two-tailed t-test performed for (K). * p < 0.05, ** p < 0.01, *** p < 0.001, ns = not significant.

