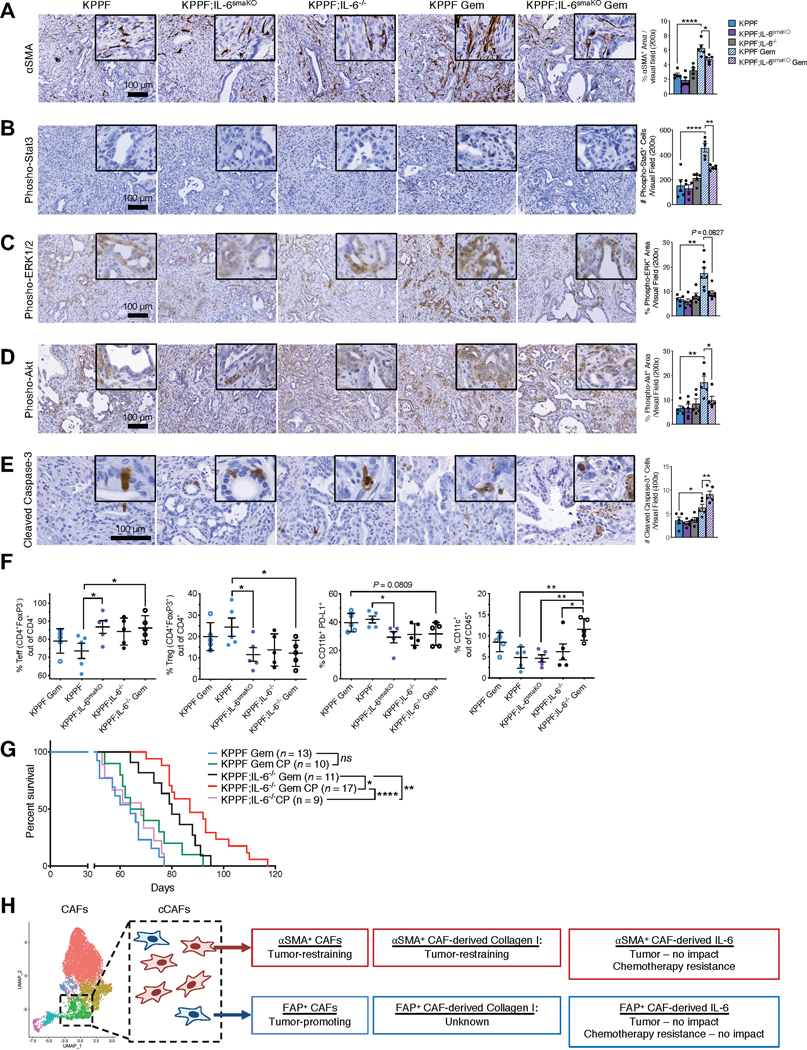
Figure 6. IL-6 produced by CAFs differentially regulates pancreatic tumor immune profile and therapeutic response.
(A-E) Representative images of PDAC tissues from KPPF, KPPF;IL-6smaKO, or KPPF;IL-6−/− mice with or without gemcitabine treatment, stained with αSMA (A), phospho-Stat3 (B), phospho-ERK1/2 (C), phospho-Akt (D), and cleaved caspase-3 (E). n = 5 mice per group for (A), (B), (D), and (E). For (C), KPPF, n=5; KPPF;IL-6smaKO, n=5; KPPF;IL-6−/−, n=5; KPPF Gem, n=7; KPPF;IL-6smaKO Gem, n=7. Scale bars: 100 μm. One-way ANOVA with Sidak’s multiple comparison test performed for A-B, D-E. Kruskal-Wallis with Dunn’s multiple comparison test performed for C.
(F) Percentages of CD4+FoxP3− effector T cells (Teff), CD4+FoxP3+ regulatory T cells (Treg), Teff/Treg ratio, CD11b+PD-L1+ cells, and CD11c+ cells in PDAC tissues of the indicated experimental groups (n = 5 per group, examined at 2.5-months age after saline or gemcitabine treatment for 2 weeks). One-way ANOVA with Sidak’s multiple comparison test performed.
(G) Overall survival of KPPF and KPPF;IL-6−/− mice, treated with gemcitabine (Gem) and/or anti-CTLA4/anti-PD1 (CP) as either single-agent treatment or combined treatment. KPPF Gem, n=13, from Figure 5I; KPPF Gem CP, n=10; KPPF;IL-6−/− Gem, n=11, from Figure 5I; KPPF;IL-6−/− Gem CP, n=17; KPPF;IL-6−/− CP, n=9. Log rank Mantel-Cox test performed comparing the indicated groups. See Supplementary Table 1 for the complete nomenclature list of all mouse strains.
(H) Schematic of the functional roles of CAF subsets and their secretome in PDAC progression and response to therapy.
* p < 0.05, ** p < 0.01, **** p < 0.0001, ns: not significant.

