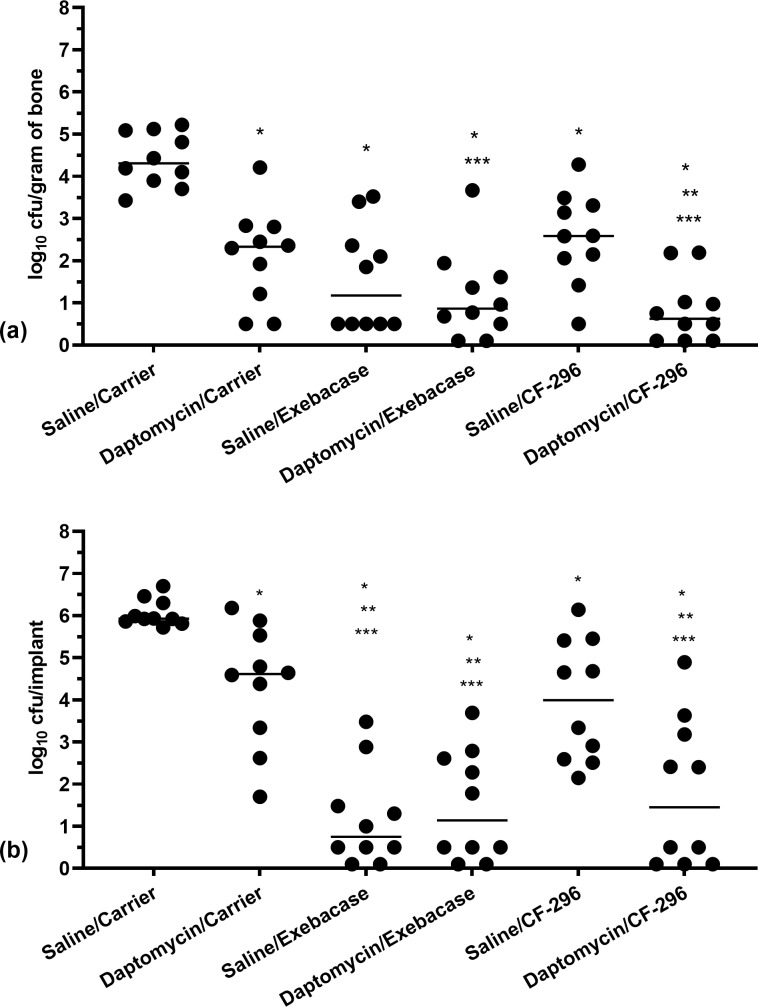
Figure 5.
Quantities of MRSA recovered from bones (a) and implants (b) on day 5. Dots represent values from individual animals; per group; horizontal lines represent median values. Asterisks indicate significant reductions compared to * saline/carrier ( ), ** daptomycin/carrier ( ), or *** saline/CF-296 ( ). (Note that slashes depict the treatment grouping, with the top being the systemic treatment given daily and the bottom being the local treatment administered at the time of surgery.)

