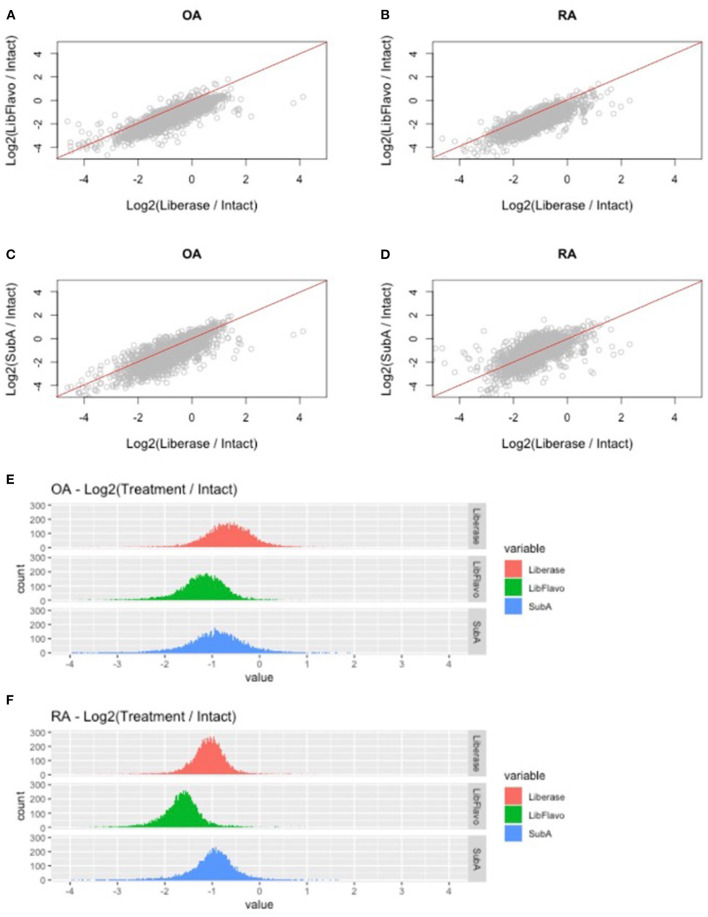
Figure 3.
RNAseq fold change comparison of gene expression using different disaggregation protocols. (A–D) Relative changes in each gene for the 3 protocols compared to intact are shown for the top 50% of expressed genes. Genes that are represented below the line are induced more in Lib compared with Lib+Flavo or SubA. (E,F) Distribution of gene expression changes in each protocol for RA and OA. Histograms are colored by disaggregation protocol. A log2 scale is used on the x-axis, so “zero” represents identical expression compared with intact. Points to the right represent induced genes.

