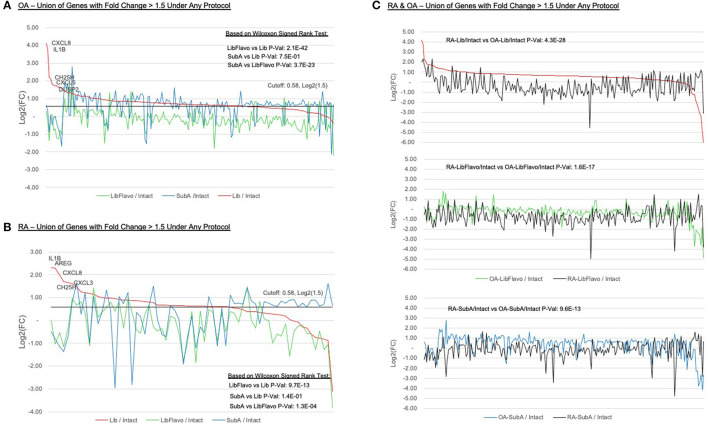
Figure 4.
Expression ratios of induced genes under treatment protocols. Relative expression of all genes with >1.5-fold induction in each protocol relative to intact in OA (A) and RA (B). Y-axis indicates log2(Protocol/Intact) value for each selected gene. “Zero” on the y-axis indicates no change in expression between protocol and intact. Genes are ordered by fold induction observed in Lib compared to Intact. Lines colors represent the disaggregation protocols. P-values calculated using Wilcoxon signed-rank method. (C) Inducement levels of all genes with >1.5-fold induction in each protocol relative to intact, displaying both OA (colored line) and RA (black line) for each protocol. Genes are ordered by fold induction observed in Lib compared to intact. P-values calculated using Wilcoxon signed-rank method. A greater difference in the RA and OA lines in each protocol indicates a greater difference in induction levels by that protocol for OA and RA.

