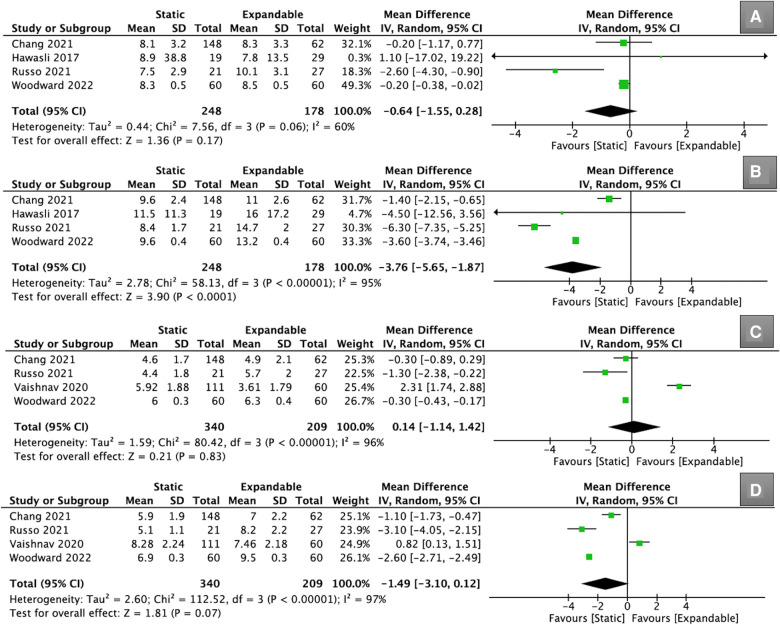
Figure 2.
Forest plots for comparison of ADH at preoperative (A) and final follow-up (B) between the static and expandable groups. Forest plots for comparison of PDH at preoperative (C) and final follow-up (D) between the static and expandable groups. ADH: anterior disc height; PDH: posterior disc height.

