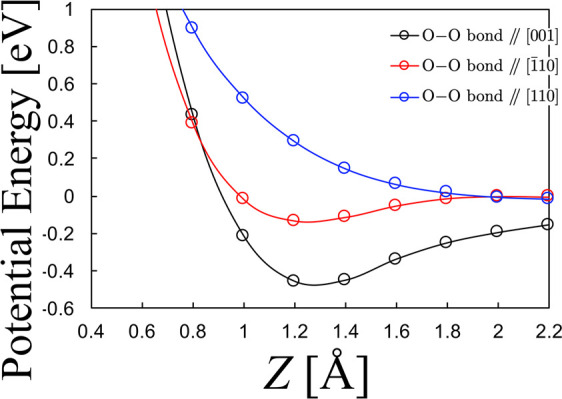
Figure 4.

Orientation dependent potential energy curves (PECs) for O2/Cu(110). PECs shown as a function of the O2 center-of-mass distance Z (Å) above a 4-fold hollow site on Cu(110). PECs calculated with the O–O bond length fixed at a gas phase equilibrium distance of 1.23 Å, and the O–O bond axis orientations fixed parallel to [1̅10], [001], and [110] on Cu(110). Energies (eV) given with respect to O2 sufficiently far (ca. 5.0 Å) from Cu(110). Structures and related figures drawn using the VESTA package.66
