Summary
During the past few years, CNO-sensitive designer G protein-coupled receptors (GPCRs) known as DREADDs (designer receptors exclusively activated by designer drugs) have emerged as powerful new tools for the study of GPCR physiology. In this chapter, we present protocols employing adeno-associated viruses (AAVs) to express a Gq-coupled DREADD (Dq) in two metabolically important cell types, AgRP neurons of the hypothalamus and hepatocytes of the liver. We also provide examples dealing with the metabolic analysis of the Dq mutant mice after administration of CNO in vivo. The approaches described in this chapter can be applied to other members of the DREADD family and, of course, different cell types. It is likely that the use of DREADD technology will identify physiologically important signaling pathways that can be targeted for therapeutic purposes.
Keywords: G-protein-coupled receptors, Designer GPCRs, G proteins, Signal transduction, Glucose homeostasis, Food intake
1. Introduction
1.1. DREADDs (Designer Receptors Exclusively Activated by Designer Drugs): General Concepts
Endogenous G protein-coupled receptors (GPCRs) are generally expressed in multiple tissues and cell types (1). As a result, it has been very challenging to study the physiological consequences of activating specific GPCR signaling pathways in distinct cell types in vivo. To address this issue, we recently started to carry out in vivo studies using muscarinic receptor-based designer GPCRs referred to as DREADDs (designer receptors exclusively activated by designer drugs) (2–4). DREADDs are unable to bind acetylcholine, the endogenous muscarinic receptor agonist, but can be activated by clozapine-N-oxide (CNO), an otherwise pharmacologically inert compound (2–4). The following two web sites provide detailed information about the availability of DREADD reagents and their experimental uses: http://chemogenetic.blogspot.com/ and http://pdspdb.unc.edu/rothlab/index.php.
During the past few years, we and others have developed DREADDs endowed with distinct G protein coupling properties (2–5). One major goal of our laboratory is to use DREADDs to identify GPCR signaling pathways that are critical for regulating glucose and energy homeostasis. Hopefully, this work will reveal potential novel targets for the treatment of obesity, type 2 diabetes, and related metabolic disorders.
In this chapter, we describe studies with an M3 muscarinic receptor-derived DREADD that selectively couples to G proteins of the Gq family (2, 5) (Fig. 1). For the sake of simplicity, we refer to this Gq DREADD simply as ‘Dq’ in this chapter. Obviously, the protocols described in the following can be applied to other members of the DREADD family.
Fig. 1.
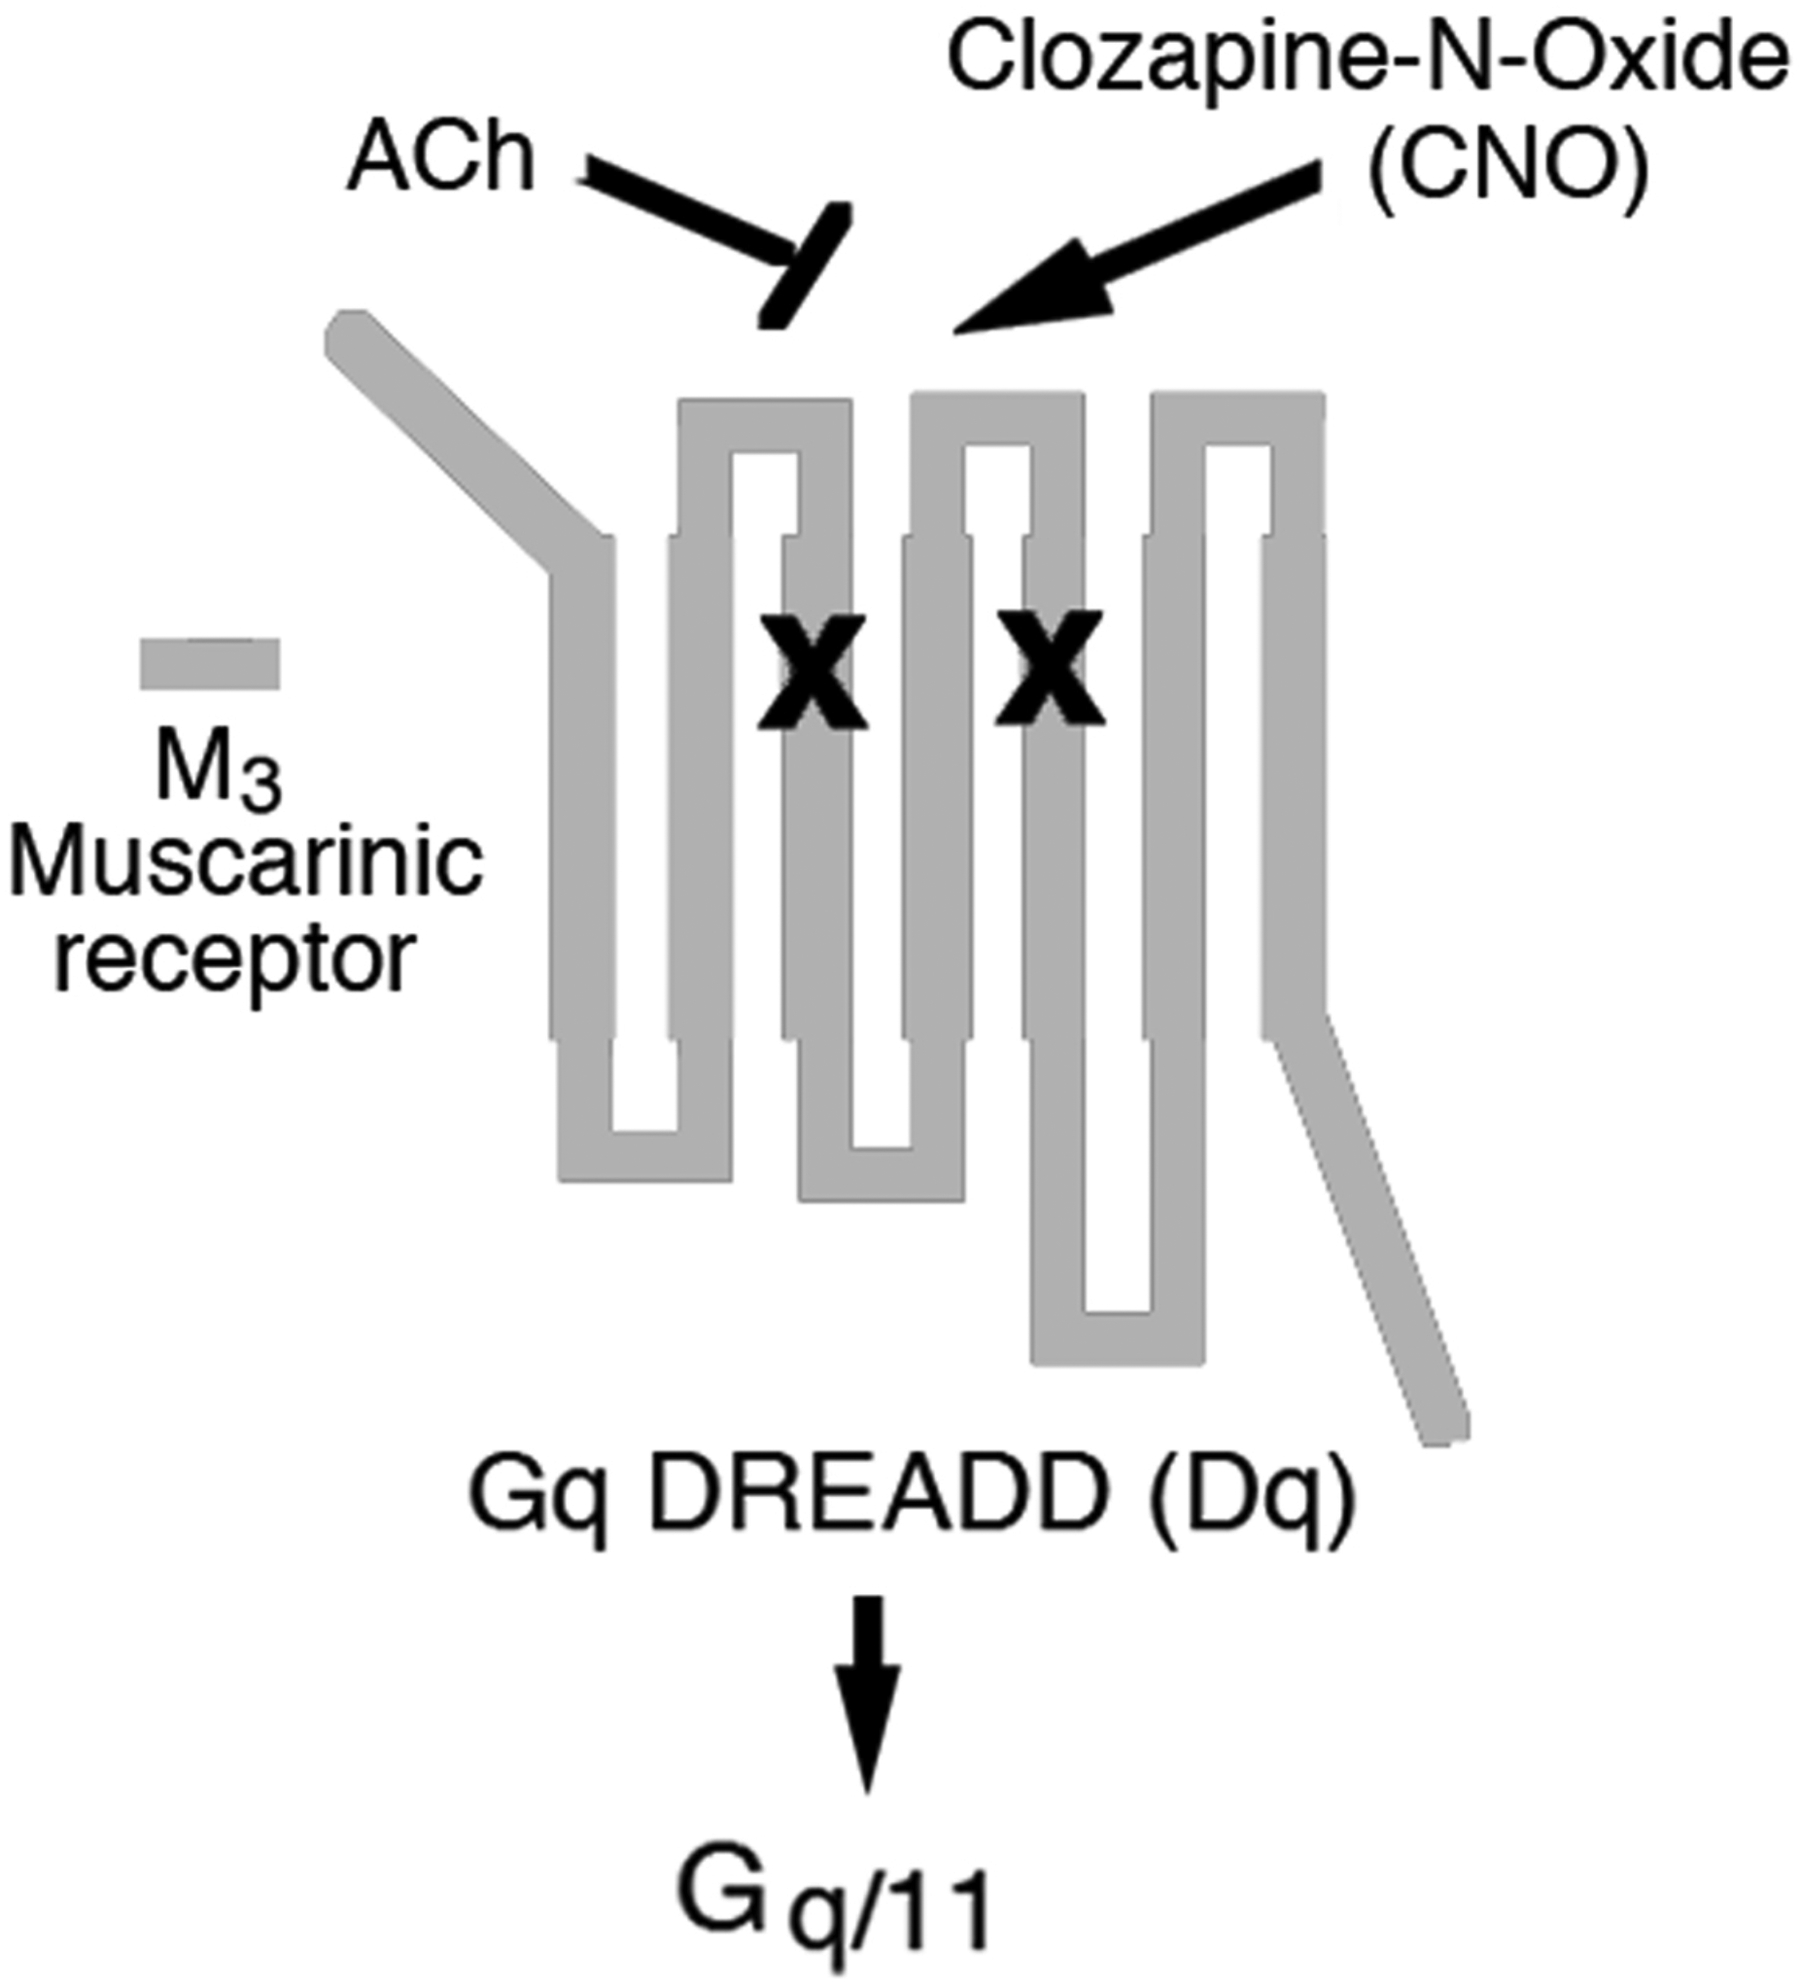
Structure of a DREADD that selectively activates G proteins of the Gq family (Dq). The Gq DREADD shown in this figure represents a mutant M3 muscarinic receptor (2). Like all other DREADDs, the Gq DREADD contains the Y3.33C and A5.46G point mutations in TM3 and TM5, respectively (indicated by the ‘x’ marks). Due to the presence of these point mutations, DREADDs are unable to bind acetylcholine (ACh), the endogenous muscarinic receptor agonist. However, DREADDs can be activated by CNO, an otherwise pharmacologically inert drug, with high potency and efficacy. In this chapter, we refer to the M3 receptor-based Gq DREADD simply as ‘Dq’.
1.2. Use of Adeno-Associated Viruses (AAVs) to Express DREADDs in a Cell Type-Specific Fashion
Specifically, this chapter deals with the use of adeno-associated viruses (AAVs) to express Dq in specific cell types of the mouse. We will describe the use of recombinant AAV technology to express Dq selectively in AgRP neurons of the arcuate nucleus of the hypothalamus and hepatocytes of the liver. The approaches described in this chapter should prove useful to advance our knowledge about the regulation of metabolic pathways that are critical for maintaining glucose and energy homeostasis.
The use of recombinant AAVs to express genes in specific cell types of the mouse (or other experimental animals) has many advantages (however, see Note 1).
AAVs trigger only a mild immune response; they are nonpathogenic to humans.
AAVs infect many different cell types including non-dividing cells. However, the infection efficiency varies based upon AAV serotype (see Note 2).
AAVs usually do not integrate into the host cell genome (in the absence of rep genes); thus the risk of insertional mutagenesis is low.
Recombinant AAVs can be obtained at high titer.
AAV-mediated expression of a recombinant protein is long-lasting (at least for several months in mice).
1.3. Use of DREADD Technology to Study the Function of AgRP Neurons
AgRP neurons are present in arcuate nucleus (ARC) of the hypothalamus. These neurons play a central role in regulating food intake and energy homeostasis (7, 8). Activation of this set of neurons leads to increased food intake and reduced metabolic rate, leading to increased body fat mass (7–9). The use of DREADD technology makes it possible to assess the physiological consequences of activating different types of G proteins selectively in AgRP neurons (8, 10–12). Activation of Dq generally results in neuronal stimulation, while activation of Di, a Gi DREADD, usually causes neuronal inhibition (3, 4).
Recombinant AAVs are now widely used to achieve DREADD expression in distinct neuronal subpopulations of the brain, including AgRP neurons (3, 4, 8, 10–12). Virus-based gene delivery approaches offer the advantage that they do not require the time-consuming development of novel transgenic mouse lines. Recently, AAVs have been used that contain the coding sequence of a particular DREADD in an inverted fashion, surrounded by two pairs of heterotypic, antiparallel loxP sites (3, 4, 7, 8). Following the stereotaxic injection of such AAVs into a particular brain region of a Cre driver line, Cre recombinase restores the proper orientation of the DREADD coding sequence only in those neurons that express Cre, thus restricting DREADD expression to distinct neuronal subpopulations. This experimental approach is usually referred to as a double-floxed inverted open reading frame (DIO) technology (13) or FLEX switch (14) (Fig. 2). In the following, we will describe AAV DIO technology that can be used to express Dq selectively in AgRP neurons (also see ref. 8).
Fig. 2.
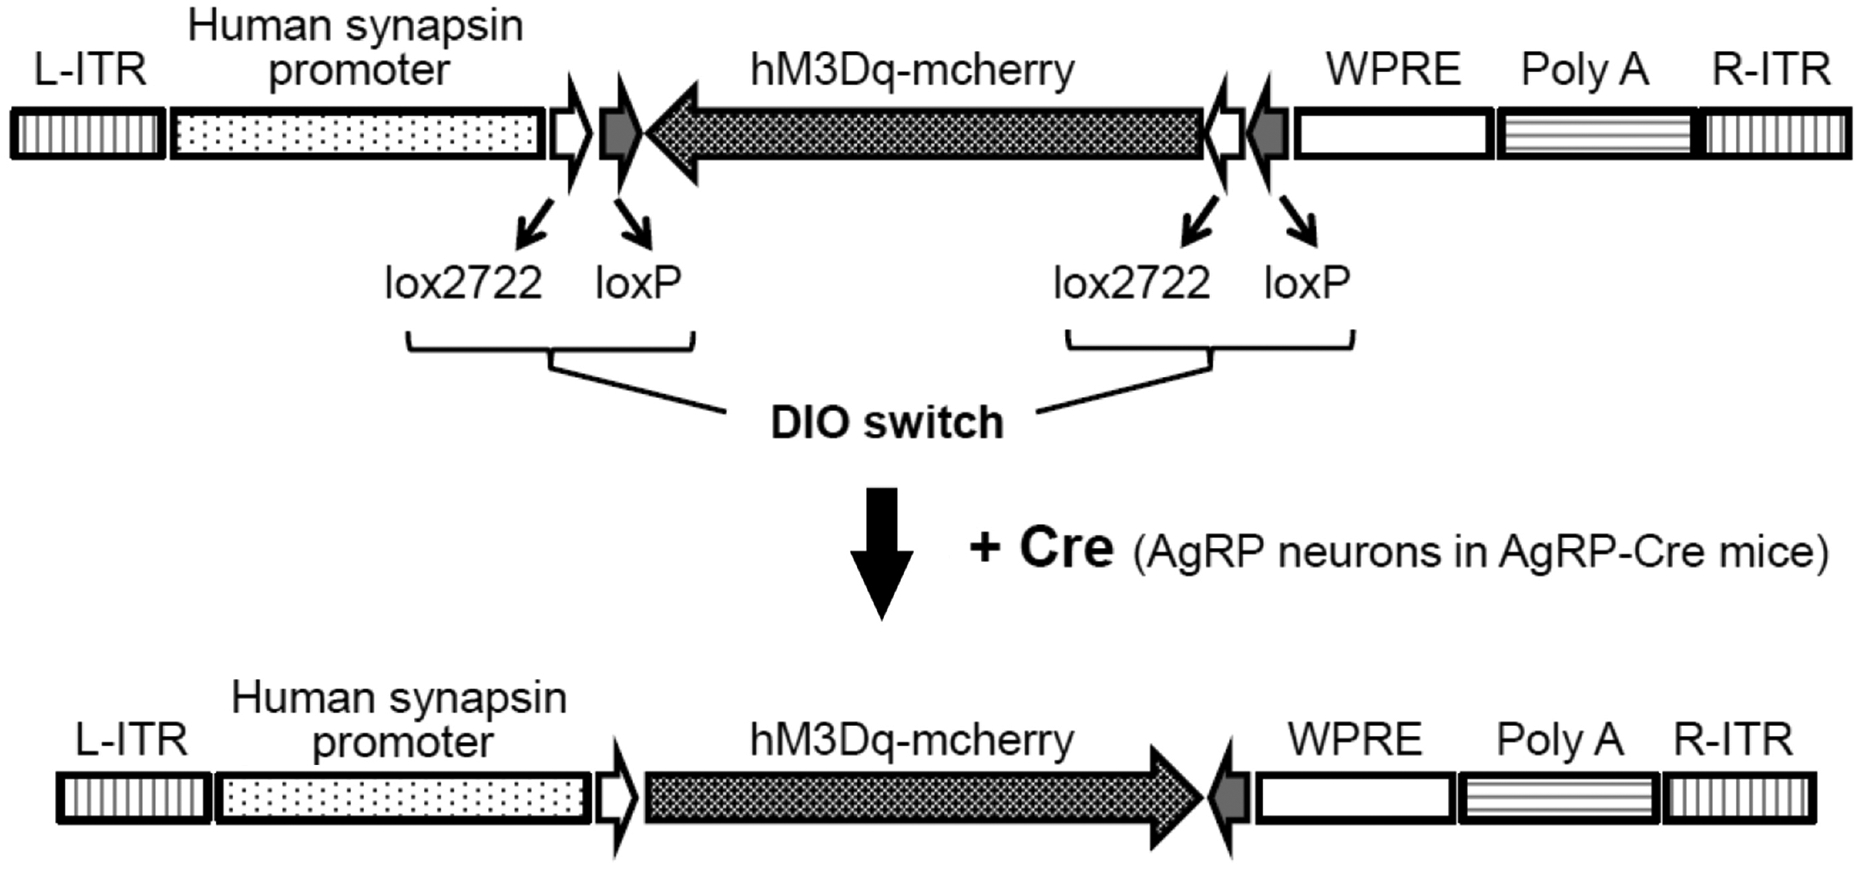
Use of AAV-DIO technology to selectively express a DREADD in AgRP neurons. The DREADD (hM3Dq-mcherry = Dq) coding sequence is surrounded by two pairs of heterotypic, antiparallel loxP recombination sites which allow for Cre-dependent transgene inversion and expression under the control of the human synapsin promoter (8). In the scheme shown here, Cre recombinase is selectively expressed in AgRP-neurons of AgRP-Cre mice. As a result, injection of the DREADD-AVV into the arcuate nucleus of these mice results in the selective expression of Dq in this subpopulation of hypothalamic neurons. L-ITR, left-inverted terminal repeat; WPRE, woodchuck hepatitis virus posttranscriptional regulatory element; R-ITR, right-inverted terminal repeat.
1.4. Use of DREADD Technology to Study Hepatocyte Function
The liver plays a central role in the regulation of blood glucose homeostasis. Importantly, increased hepatic glucose production is a hallmark of type 2 diabetes (17). The selective expression of Dq in hepatocytes makes it possible to evaluate the in vivo consequences of stimulating a Gq-coupled receptor on liver glucose fluxes and whole body glucose homeostasis. In this chapter, we will provide an AAV-based protocol to achieve selective expression of Dq in hepatocytes of the mouse liver.
2. Materials
2.1. Generation and Analysis of Mice Expressing Dq Selectively in AgRP Neurons
2.1.1. AAV Design and Generation of Viral Particles
pAAV-hSyn-DIO-hM3Dq-mcherry plasmid (Addgene plasmid 44361) (see Note 3)
Stbl3 E. coli. competent cells (Life Technology) (see Note 4)
LB-Ampicillin (Amp) media and LB-Amp plates
Plasmid extraction kit (e.g. Qiagen Plasmid Midi Kit)
AAV production kit (e.g. AAV Helper-Free System, Agilent) (see Note 5; also see ref. 15)
2.1.2. AAV Microinjections into the ARC of AgRP-ires-cre Mice
Animals: AgRP-ires-cre knockin mice (strain name: Agrp-tm1(cre)Lowl/J; The Jackson Laboratory, stock # 012899) (ref. 16)
Viruses: AAV-hSyn-DIO-hM3Dq-mCherry (titer: 8 × 10¹²) and AAV-hSyn-DIO-mCherry (control virus; titer: 5 × 10¹²) (UNC Vector Core)
CNO (clozapine-N-oxide) (e.g. Toronto Research Chemicals)
Stereotaxic frame: Model 940A small animal stereotaxic instrument with digital display console and model 923-B mouth gas anesthesia head holder (David Kopf Instruments)
UltraMicroPump-UMP3 plus Micro4 microSyringe pump controller (World Precision Instruments)
Micro drill: K1070 High-speed micro drill (# 51449, Stoelting) with 0.45 mm drill bits (#51448, Stoelting)
Syringe: Hamilton 10 μl syringe, 701RN, model 7635–01
Needles: Hamilton 16 mm blunt stainless needles, 7803–05, 33G
Anesthesia vaporizer: Sigma Delta Vaporizer (Penlon)
-
Anesthetic: 2,2,2-Tribromoethanol (Avertin®) (Sigma-Aldrich #T4)
Dissolve 1.25 g of 2,2,2-tribromoethanol in 2.5 ml of 2-methyl-2-butanol (Sigma-Aldrich), dilute with distilled water to 100 ml, filter through a 0.2 micron filter, and then store the solution in a dark bottle at 4 °C for 2–3 weeks.
Never use a solution that is yellow or contains a precipitate because this indicates that oxidation has occurred.
Isoflurane (Forane®, Baxter, NDC 10019-360-60)
Ketoprofen (from Zoetis), 2.5–5 mg/kg (s.c.), or meloxicam (0.2–0.5 mg/kg s.c.; Vet One)
Lidocaine solution (1%; Hospira)
GLUture topical tissue adhesive (Abbott)
GenTeal lubricant eye ointment (Alcon)
Loctite 454 glue (Henkel)
Cannulas for i.c.v. injections (Plastic One): Guide cannula, 2.6 mm, C315GS-2W; internal cannula fitting the guide cannula with 1 mm projection, C315IS-2/SPC; dummy cannula, C315DCS-2
Other surgical supplies: Grabber 7+ hour hand warmers (Grabber Performance), alcohol prep pads, cotton tipped applicators
2.1.3. Immunohistochemical Detection of Dq Expression in AgRP Neurons
4% Paraformaldehyde (PFA) for perfusion (500 ml): dissolve 20 g PFA and 10.94 g Na2HPO4 in 400 ml of water via stirring and heating (65 °C), then add 1.3 g NaH2PO4, and water to 500 ml. Finally filter the solution (use a 0.45 μl filter) and keep it on ice prior to use. Make fresh PFA solution for each perfusion.
Sucrose (20%) solution in normal saline
CNO solution (0.1 mg/ml) in normal saline
Micro-perfusion pump: Masterflex 77120–70 or an equivalent device
Microtome: Leica SM1020R, Leica VT1000s, or another equivalent device
Cryoprotectant solution: 150 ml ethylene glycol, 150 g sucrose, 5 g PVP40 in 250 ml of 0.1 M phosphate buffer (pH 7.4)
Blocking solution: 1x PBS, 5% normal goat serum (NGS), 0.25% Triton 100
Washing buffer: 1x PBS, 0.5% Triton 100
Red fluorescence protein (RFP) antibody: ab34764, FITC-conjugated (Abcam)
c-fos antibody: ab7963 (Abcam)
Secondary antibody: goat anti-rabbit, FITC-conjugated (Invitrogen)
12 well plate for free floating staining (Corning)
Microscope slides (12-550-15, Fisher)
Mounting media: SlowFade gold antifade mountant with DAPI (Life Technologies) or Vectashield mounting medium without DAPI (Vector Laboratories)
Fluorescence microscope (e.g. Zeiss Imager D1)
Common IHC tools and devices
2.1.4. Food Intake Measurements With Mice Expressing Dq in AgRP Neurons
Regular mouse diet (5% (w/w) fat content; 4.08 kcal/g; Zeigler, Gardners, PA)
Normal saline
Clozapine-N-oxide (CNO) solution (e.g. Toronto Research Chemicals): dissolve methyl-β-cyclodextrin (Sigma-Aldrich C4555; final concentration 50 mg/ml) in normal saline in a 1.5–2 ml tube. Dissolve CNO powder in the methyl-β-cyclodextrin solution (final CNO concentration: 10 mM = 3.43 mg/ml). Mix the solution well at 30–37 °C to dissolve CNO completely. Dilute the CNO solution with normal saline to generate a 0.1 mg/ml CNO working solution for intraperitoneal (i.p.) injections. Store CNO solutions at 4 °C in the dark.
Isoflurane (Forane®, Baxter) and isoflurane vaporizer (Sigma Delta Vaporizer, Penlon)
2.2. Generation and Analysis of Mice Selectively Expressing Dq in Hepatocytes
2.2.1. Generation of the AAV-TBG-Dq Construct and Virus Production
AAV-TBG-MCS plasmid (a gift from Dr. Morris Birnbaum, The University of Pennsylvania, Philadelphia, PA)
pcDNA3.1-Dq (ref. 18)
SURE E. Coli competent cells (Agilent)
LB-carbenicillin and carbenicillin plates (KD Medical)
EndoFree Mega plasmid preparation kit (Qiagen)
AAV production kit (e.g. AAV Helper-Free System, Agilent)
2.2.2. AAV-Mediated Expression of Dq in Hepatocytes of Mice
C57BL/6NTac mice (Taconic Biosciences)
AAV-TBG-eGFP control virus (The University of Pennsylvania Vector Core Facility
AAV-TBG-Dq
Mouse Tail illuminator Restrainer (Braintree Scientific; Model: MTI).
CNO (e.g. Toronto Research Chemicals)
Saline (sterile)
Rabbit monoclonal HA-tag antibody (Cell Signaling Technology) and mouse anti-sodium potassium ATPase α 1 monoclonal antibody (Abcam)
Heat lamp
2.2.3. CNO Treatment of Hep-Dq Mice Increases Blood Glucose Levels
Hep-Dq mice (C57BL/6 mice injected with the AAV-TBG-Dq virus)
Hep-eGFP mice (C57BL/6 mice injected with the AAV-TBG-eGFP control virus)
CNO (e.g. Toronto Research Chemicals)
Blades for mouse tail bleedings (e.g. single-edged razor blades from GEM Blue Star)
Regular mouse restrainer
Automated blood glucometer (Contour; Bayer)
3. Methods
3.1. Generation and Analysis of Mice Expressing Dq Selectively in AgRP Neurons
3.1.1. AAV Design and Generation of Viral Particles
Transform the pAAV-hSyn-DIO-hM3Dq-mcherry plasmid into Stbl3 competent cells using standard procedures. Incubate LB-Amp plates at 37 °C for 16–20 hr.
Pick a single bacterial colony and start a large scale E. coli culture using 500–2000 ml of LB-Amp medium (shake at 200 rpm and 37 °C for 16–20 hr).
Isolate the pAAV-hSyn-DIO-hM3Dq-mcherry plasmid with a plasmid purification kit.
Generate AAV particles (serotype 8) using a commercial AAV amplification kit (see Note 5).
3.1.2. AAV Microinjections into the ARC of AgRP-ires-cre Mice
Set up the stereotaxic equipment, calibrate the device.
After weighing the mouse, inject 16 μl/g of Avertin to anesthetize the animal. Place the anesthetized mouse on a heating pad to protect it from hypothermia during anesthesia, surgery, and recovery.
Properly place the animal on the stereotaxic frame, using Kopf 922 mouse ear bars and the mouthpiece of the stereotaxic frame to secure the mouse head.
Set up the isoflurane vaporizer, adjust the isoflurane level to 1 and the oxygen flow level to 0.8–1, respectively; keep these settings constant throughout surgery.
Apply lubricant eye ointment to prevent the eyes from drying out during the surgery.
Inject 0.1 ml of 1% lidocaine s.c. into the scalp above the surgical region, wait for 2–3 min, then either shave (with an electric shaver) or pluck the hair at the surgical site, disinfect the surgical area with betadine solution, and wipe with an alcohol pad.
Use a surgical blade to make a small vertical incision along the dorsal axis of the skin. Apply ethanol with a cotton tip applicator to dry the skull and to make the lambda and bregma points on the skull surface better visible.
Level the brain on the vertical plane (rostral-caudal axis) and horizontal plane (medial-lateral axis) as described in the manufacturer’s manual.
Use a burr drill over the appropriate stereotaxic coordinates (to target the arcuate nucleus (Fig. 3A), we use the following coordinates: anterior-posterior from bregma: −1.40 mm; medial-lateral from bregma: ±0.25 mm) to puncture a small hole into the skull surface.
Use a clean Hamilton syringe filled with 2–3 μl of AAV (either AAV-hSyn-DIO-hM3Dq-mCherry or AAV-hSyn-DIO-mCherry as control).
Recheck the positions of bregma and lambda and move the needle to the above coordinates. Make sure the needle has no clog and set the pump to a 300 nl injection volume (injection speed: 50 nl per min). Then move the needle down from the surface of the skull to −5.8 mm and press the ‘run’ button of the Micro4 miniPump controller to start the injection. Record the position of the viral solution column in the syringe at the beginning and at the end of the injection, to make sure that the proper amount of virus was injected.
After the injection, wait for 5 more min to allow the injected virus to settle, then slowly pull up the needle.
Repeat the same injection on the contralateral side (see step 11).
Clean the skull with a saline-filled applicator, apply tissue glue to close the wound, and use a 7 mm wound clip to secure the wound from opening.
Inject (s.c.) 0.5 ml of warm saline to prevent dehydration and 0.1 ml of ketoprofen (s.c.) to prevent post-operative pain.
Monitor the mouse for 3 more days post-surgery, inject 0.1 ml of ketoprofen (s.c.) daily.
Remove the wound clip 10 days post-surgery. The mouse is now ready for phenotyping studies.
Fig. 3.
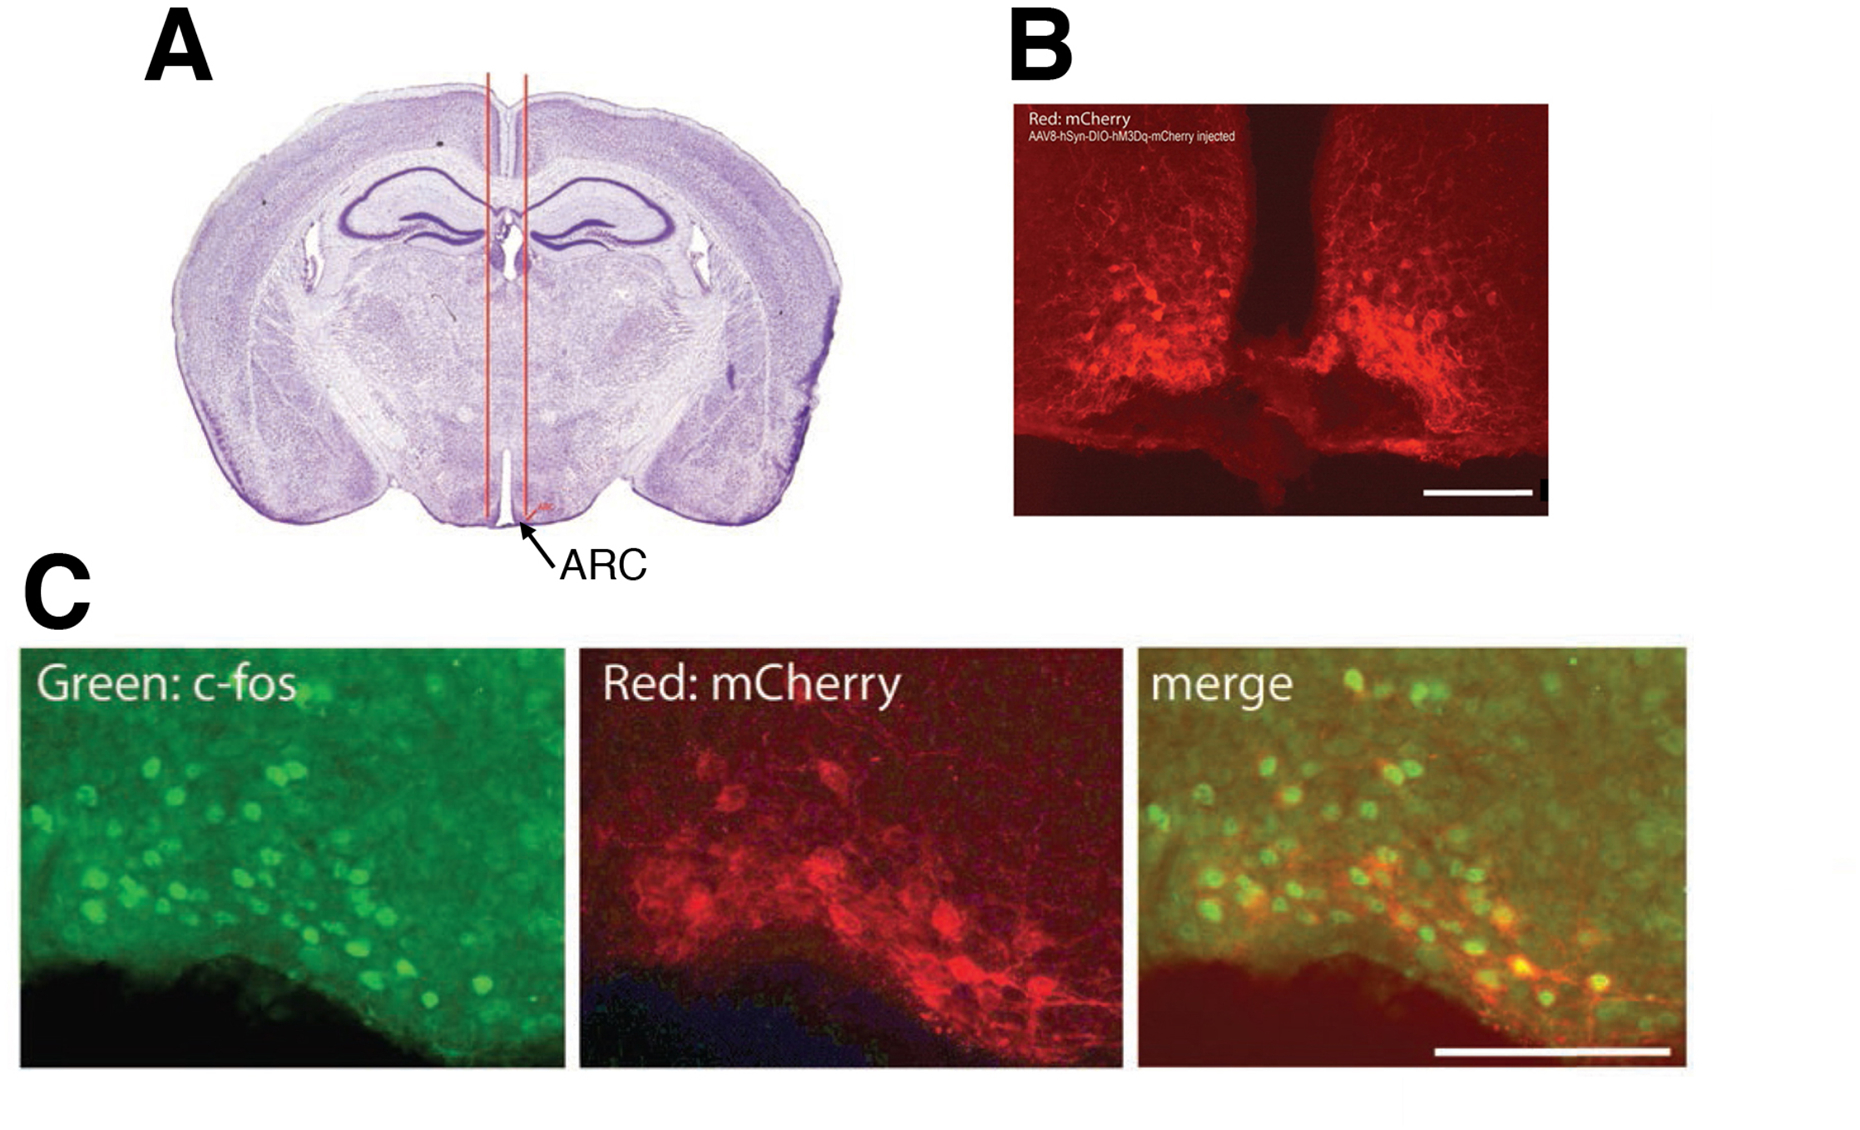
Injection of a Dq DIO AAV into the arcuate nucleus of AgRP-ires-Cre mice. (A) Stereotaxic injection of the AAV into the mouse arcuate nucleus (ARC). (B) The AAV8-hSyn-DIO-hM3Dq-mCherry virus was injected bilaterally into the ARC of an AgRP-ires-Cre mouse. mCherry (Dq-mCherry) expression was detected via direct fluorescent imaging. See text for experimental details. (C) Immunohistochemical detection of c-fos expression in CNO-injected mice expressing Dq (Dq-mCherry) in AgRP neurons of the ARC. See text for experimental details. Scale bar, 100 μm.
3.1.3. Immunohistochemical Detection of Dq Expression in AgRP Neurons
The expression of Dq can be monitored in a functional assay by imaging CNO-induced c-fos expression (Note 11). About 90–120 min prior to perfusion, inject 0.2 mg/g of CNO i.p.
Inject 0.5–0.6 ml of Avertin i.p. to achieve deep anesthesia.
Perfuse the mouse transcardially with 20 ml of cold saline followed by 50 ml of 4% PFA.
Carefully remove the brain from the skull and store it in 4% PFA overnight. Then store the brain in 20% sucrose solution at 4 °C for 1–2 more days.
Use a microtome to obtain 30 μm brain sections, covering the region that contains the arcuate nucleus (~ −1.40 mm to −2.60 mm from bregma).
Collect the brain sections in 4 sets of sample pools and store them in cryoprotectant solution in 12 well plates at −20 °C.
Take out one set of brain sections and wash 3 times with 1x PBS.
Mount the sections on Superfrost Plus microscope slides (Fisher) and mark the slides with the mouse ID number and other important information.
Check direct fluorescence with a red filter to image Dq (Dq-mcherry) expression.
To detect CNO-induced c-fos activation, take out another set of brain sections (see step 6) and wash 3 times with 1x PBS.
Add c-fos antibody (ab99515; dilution: 1:500) in 1 ml of blocking solution and incubate at 4 °C overnight.
If mCherry fluorescence is weak or undetectable, use another set of brain sections, wash 3 times with 1x PBS, add RFP antibody (ab34764; dilution: 1:500) and incubate at 4 °C overnight (ab34764 is a FITC-conjugated antibody; thus no secondary antibody is needed).
For c-fos staining, wash brain sections 3 times with 1x PBS, add secondary antibody (FITC-conjugated goat anti-rabbit antibody; A11008; dilution: 1:1000) in 1 ml of blocking solution, incubate for 2 hr at room temperature, then wash brain sections 3 times with 1x PBS.
Mount the sections onto Superfrost Plus slides, and mark the slides with mouse ID number, antibodies used, and other important information.
Obtain images with a fluorescence microscope (e.g. Zeiss Imager D1). Use a red filter to visualize mCherry expression and a FITC filter to obtain images showing c-fos expression (Fig. 3; Note 12).
After staining with the FITC-conjugated RFP antibody, use a FITC filter to visualize mCherry expression, indicative of the expression of the Dq-mCherry fusion protein (Fig. 3).
3.1.4. Food Intake Measurements With Mice Expressing Dq in AgRP Neurons
After a 10–14 day recovery period, AAV-injected AgRP-ires-cre mice can be used for food intake studies. For these measurements, mice are individually housed starting from the day of AAV injections.
To study potential increases in food intake, start measuring food intake in the morning (between 9:00–10:30 a.m.) when mice usually have little appetite (mice consume most of their food at night). Move a singly housed mouse into a new cage and measure its body weight.
Prepare CNO or saline solution for i.p. injection (see Note 13).
Place the mouse into the anesthesia chamber (use 1–2% isoflurane gas).
Inject CNO or saline solution i.p. under isoflurane anesthesia.
Move the animal back to a newly prepared regular mouse cage and let it recover from the anesthesia (see Note 14).
Measure the total weight of the food pellets (5–6 pellets/cage; 1 pellet usually weighs 2.5 to 4 g) and put the pellets in the food hopper.
Measure food intake at 0.5, 1, 2, 4, 24, and 48 hr after i.p. injection of either saline or CNO solution (1 mg/kg i.p.) by accurately weighing uneaten food pellets.
One week after the i.p. injections, repeat the experiments in a crossover study. Mice that received saline in week 1, are injected with CNO in week 2. Analogously, mice treated with CNO in week 1 will receive saline in week 2.
Representative food intake data are shown in Fig. 4.
Fig. 4.
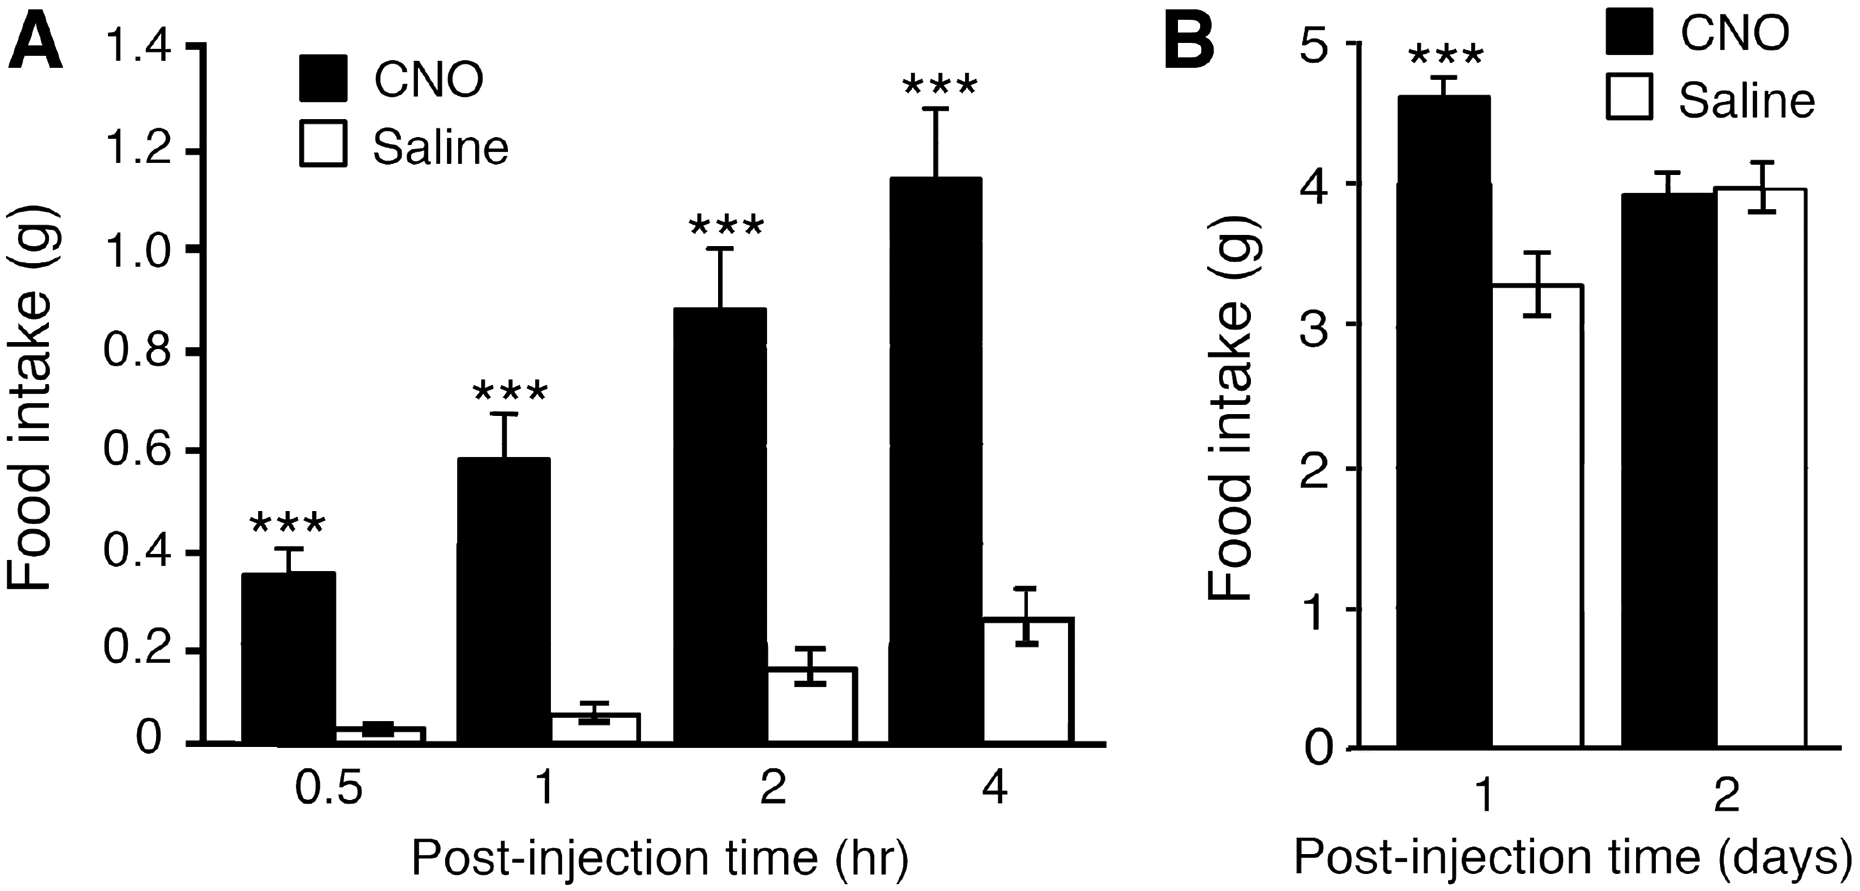
CNO treatment of mice expressing Dq in AgRP neurons (AgRP-Dq mice) triggers a dramatic increase in food intake. AgRP-Dq mice received a single i.p. injection of either saline or CNO (1 mg/kg) in the morning (between 9 and 10.30 a.m.). AgRP-Dq mice display a significant increase in food intake during the first few hours after CNO treatment (A) and after day 1 (B). This CNO-dependent orexigenic effect is no longer observed on day 2 after CNO injection (B). The data shown are from a representative experiment (K. Nakajima et al., unpublished results). Data represent means ± SEM (n=8 per group; 10–11-week-old male mice). ***p<0.001, as compared to the corresponding control group.
3.2. Generation and Analysis of Mice Selectively Expressing Dq in Hepatocytes
3.2.1. Generation of the AAV-TBG-Dq Construct and Virus Production
Cut out the Dq coding sequence containing an N-terminal HA tag from pcDNA3.1-Dq (ref. 18) as a 1.85 kb SpeI-SacI fragment. By using standard molecular biological techniques, ligate this fragment into the XbaI and ScaI sites of the AAV-TBG-MCS plasmid to obtain the AAV-TBG-Dq construct (Fig. 5).
Transform the ligation product into E. coli SURE cells (see Note 15), following the manufacturer’s protocol. Prepare endotoxin-free plasmid DNA using the EndoFree Plasmid Mega kit according to the manufacturer’s (Qiagen) protocol.
Generate viral particles by using an AAV production kit (e.g. AAV Helper-Free System, Agilent) (see Notes 16 and 17).
Fig. 5.
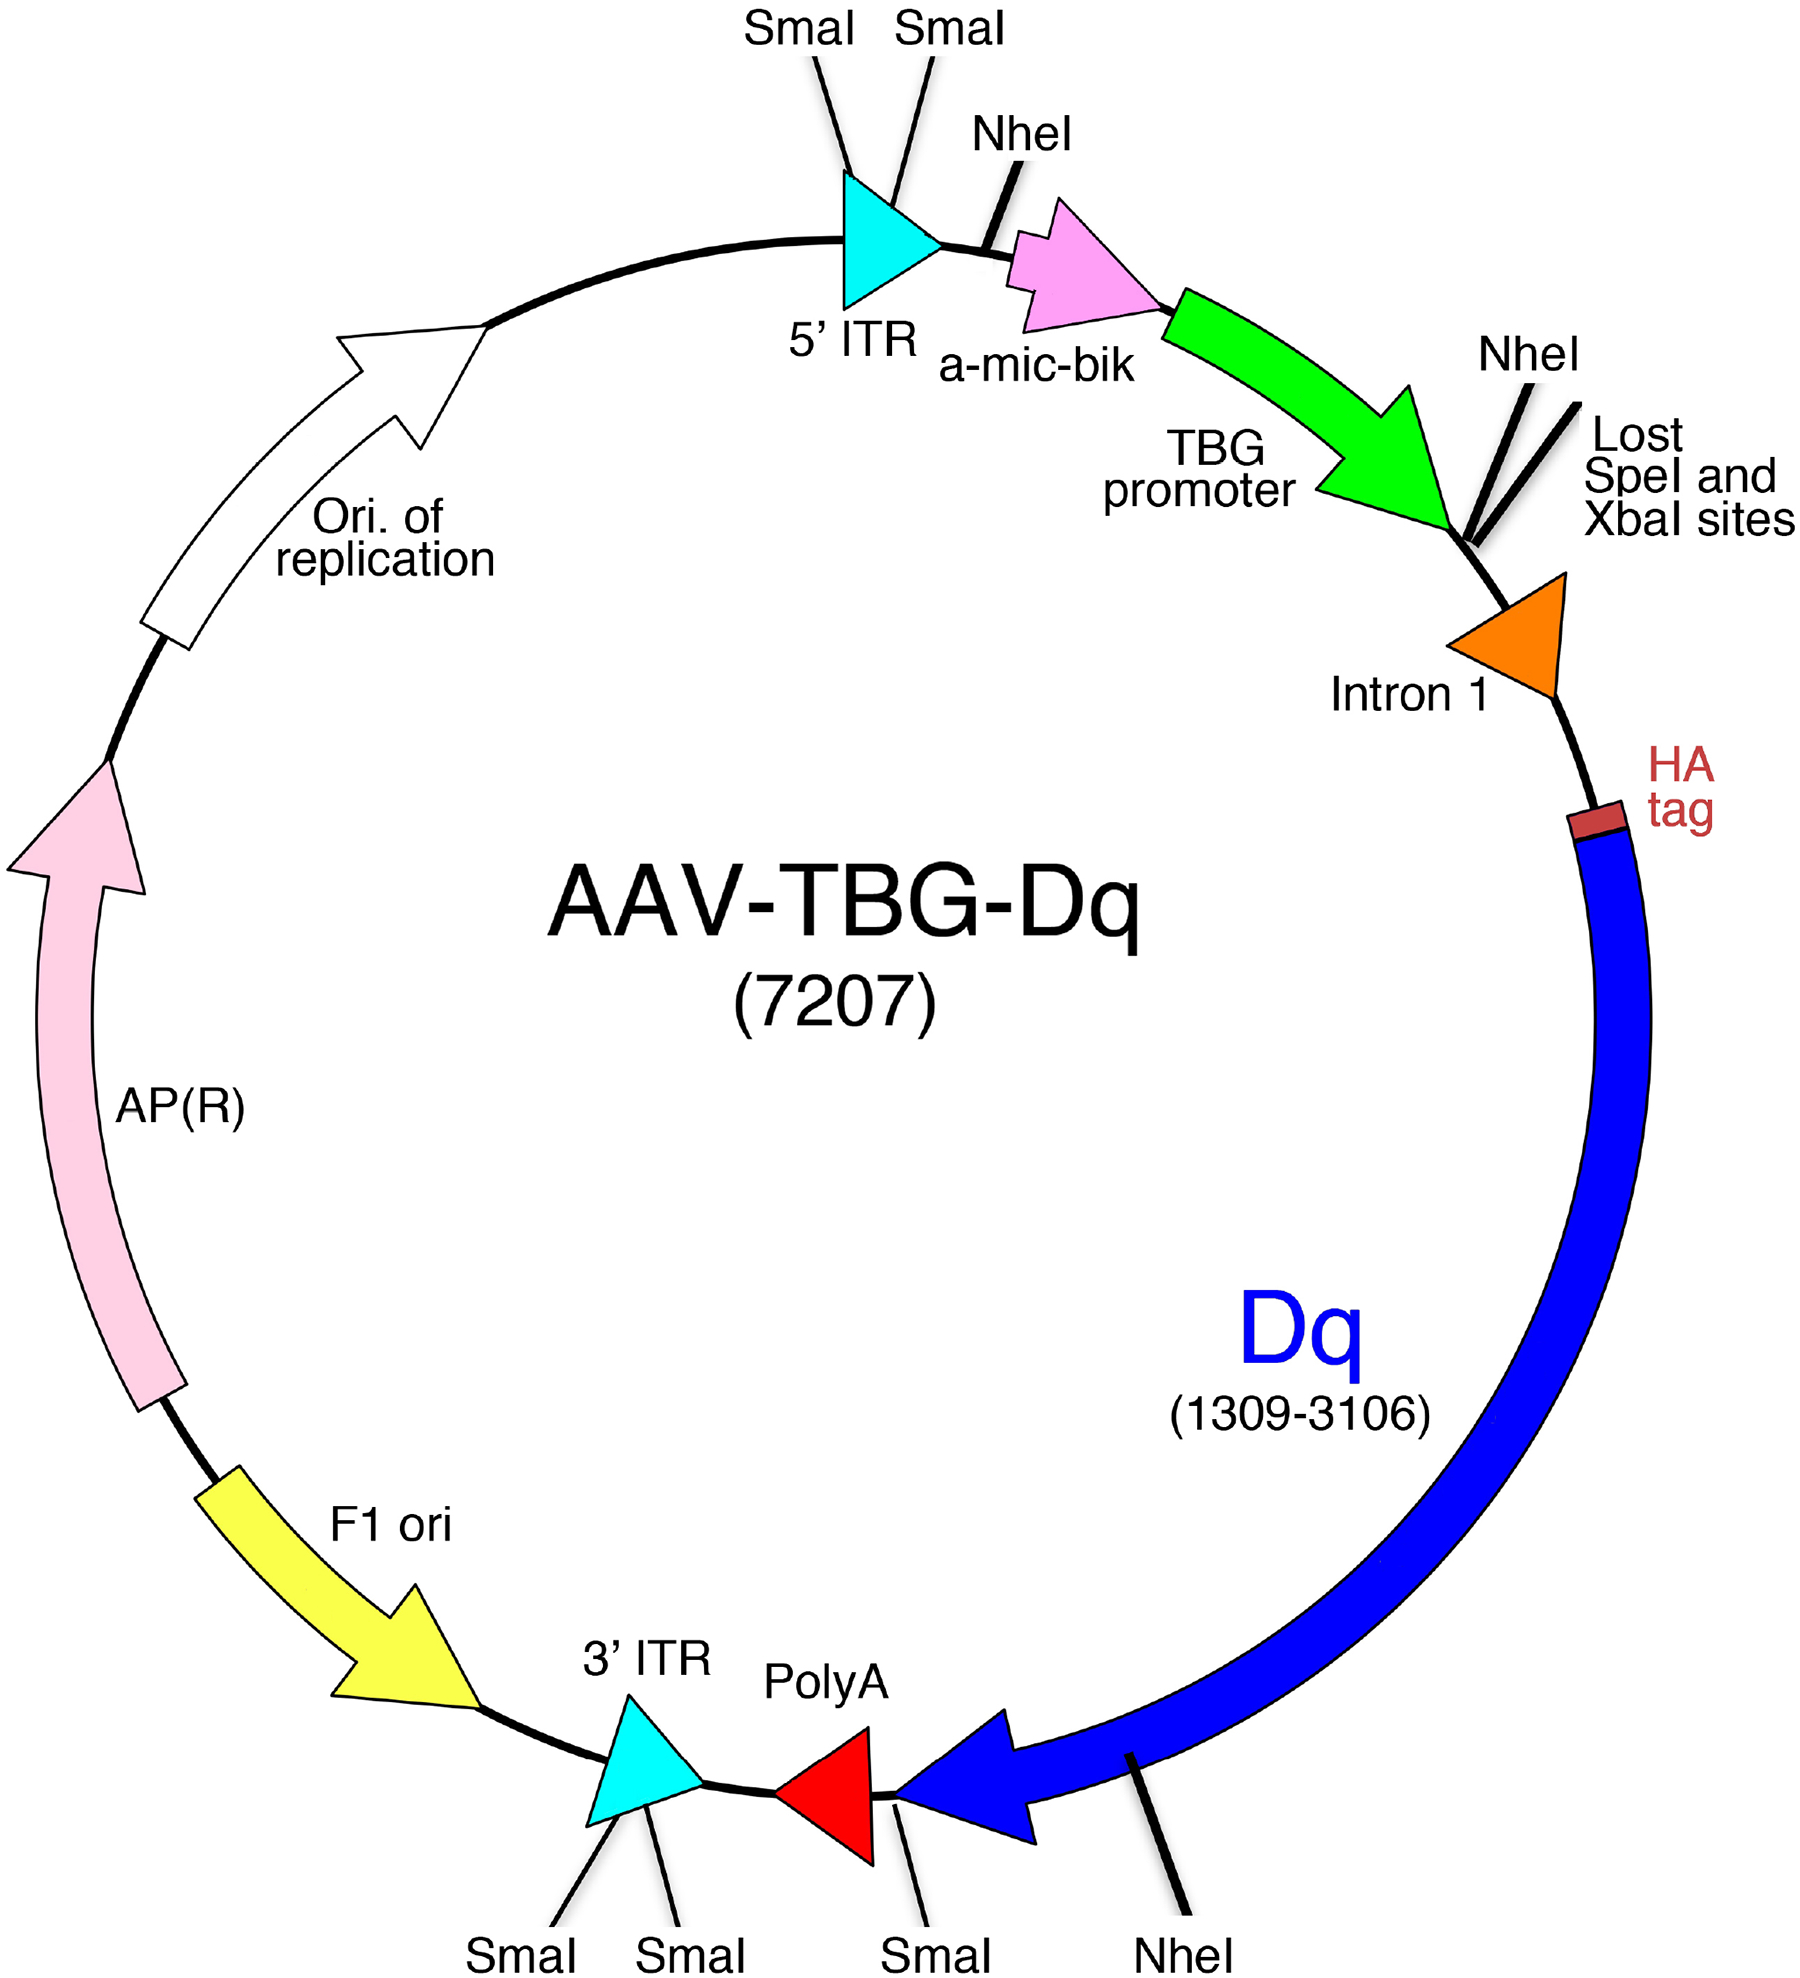
Structure of the AAV-TBG-Dq construct. Note that the Dq DREADD coding sequence is under the transcriptional control of the hepatocyte-specific TBG (thyroxine-binding globulin) promoter. See text for further details. An HA epitope tag has been fused to the N-terminus of Dq to facilitate the detection of Dq expression via Western blotting or immunohistochemical approaches.
3.2.2. AAV-Mediated Expression of Dq in Hepatocytes of Mice
Inject the AAV-TBG-Dq virus or the AAV-TBG-eGFP control virus into the tail vein of C57BL/6 mice (see Note 18).
Place the mouse under a heat lamp for a few min in order to warm up the mouse. Then place the mouse into the Mouse Illuminator Restrainer and wipe its tail with a 70% isopropanol-saturated wipe to increase tail vein visibility. If tail veins are not clearly visible at this point, place the mouse back under a heat lamp for several min. The Mouse Illuminator Restrainer device restrains the mouse so that tail vein injections and bleedings can be performed easily. It is equipped with a restraining tube and illumination source. Sliding doors keep the mouse gently restrained.
Inject the virus, either AAV-TBG-Dq or AAV-TBG-eGFP (control), into the tail vein by using an insulin syringe (1/2 cc; needle: 28G, 1/2 inch long, 0.36 ×13 mm) loaded with 100 μl of diluted AAV solution (1011 AAV genomic copies (GC) per 100 μl). Each mouse receives 1011 GC regardless of body weight.
Two to three weeks after the AAV injection, determine the liver-specific expression of Dq via Western blotting (see Fig. 6) or [3H]-NMS binding studies (note that DREADDs are still able to bind muscarinic antagonist with relatively high affinity).
Fig. 6.
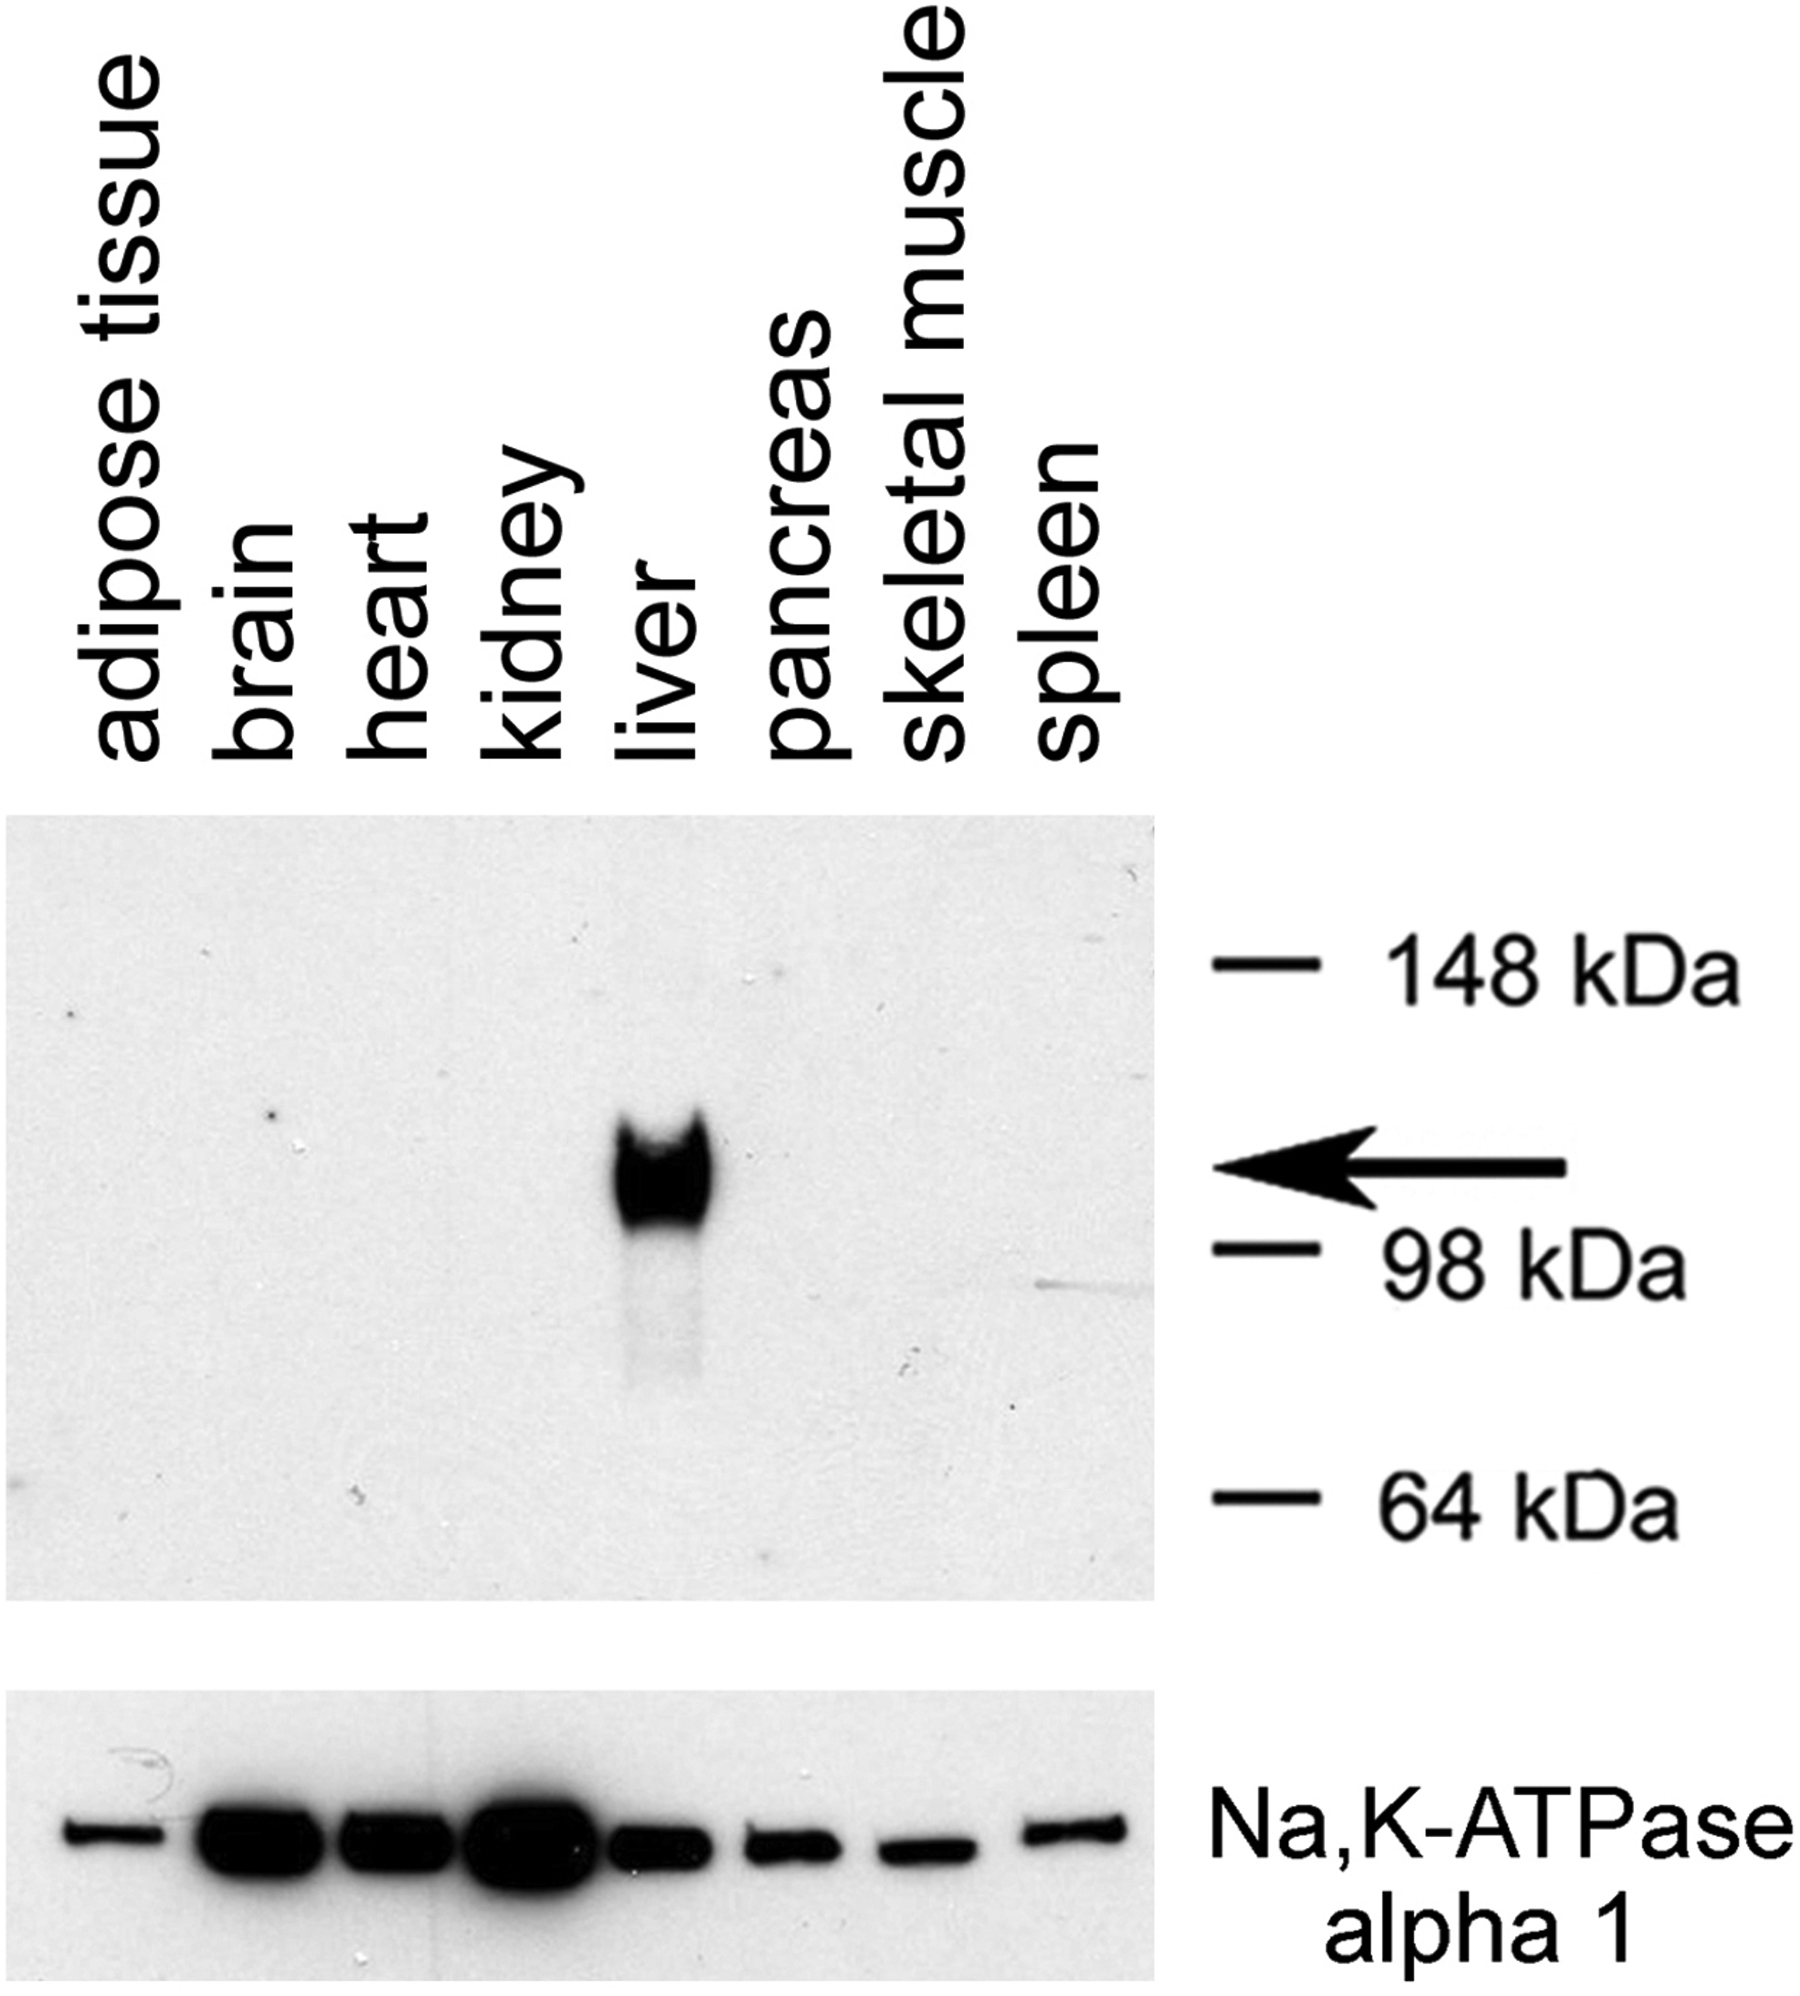
Selective expression of Dq in the liver of a mouse treated with the AAV-TBG-Dq virus. The AAV-TBG-Dq virus was injected into the tail vein of a C57BL/6 mouse. Three weeks later, membranes were prepared from the indicated tissues. Subsequently, membrane extracts were subjected to SDS-PAGE under reducing conditions (in the presence of 10% β-mercaptoethanol). Dq expression was detected via Western blotting using a rabbit monoclonal anti-HA tag antibody (note that Dq contains an N-terminal HA tag; see Fig. 5). The arrow indicates the position of the designer receptor (Dq). For control purposes, the blot was also probed with a mouse anti-α1 sodium potassium ATPase monoclonal antibody (predicted molecular mass: 112 kDa).
3.2.3. CNO Treatment of Hep-Dq Mice Increases Blood Glucose Levels
In the following, we refer to mice that selectivity express Dq in hepatocytes as Hep-Dq mice (Hep-eGFP control mice express eGFP instead of Dq in a hepatocyte-specific fashion). CNO treatment of Hep-Dq mice is predicted to trigger the activation of Gq-type G proteins selectively in hepatocytes. A representative in vivo experiment that we carried out with Hep-Dq and Hep-eGFP control mice is described below (Dq-mediated changes in blood glucose levels).
Freshly prepare a CNO solution of the desired concentration in saline.
To test whether selective activation of Dq in hepatocytes of mice affects blood glucose levels, inject Hep-Dq and Hep-eGFP mice with increasing doses of CNO (e.g. 1, 5, and 10 mg/kg, i.p.) (see Note 19).
Take blood samples from the tail just prior to injection (time ‘0’) and 15, 30, 60, 90, and 120 min post-injection. Measure blood glucose levels with an automated blood glucose reader.
Generate a plot with time on the x axis and blood glucose levels on the y axis.
For example, Fig. 7 shows CNO injection data obtained with fasted Hep-Dq and Hep-eGFP control mice. The data clearly indicate that CNO-mediated activation of Dq in hepatocytes results in a pronounced increase in blood glucose levels, most likely due to increased hepatic glucose output. This observation is consistent with the outcome of a previous study in which we analyzed a transgenic mouse strain in which the expression of Dq was under the transcriptional control of the albumin promoter (19).
Fig. 7.
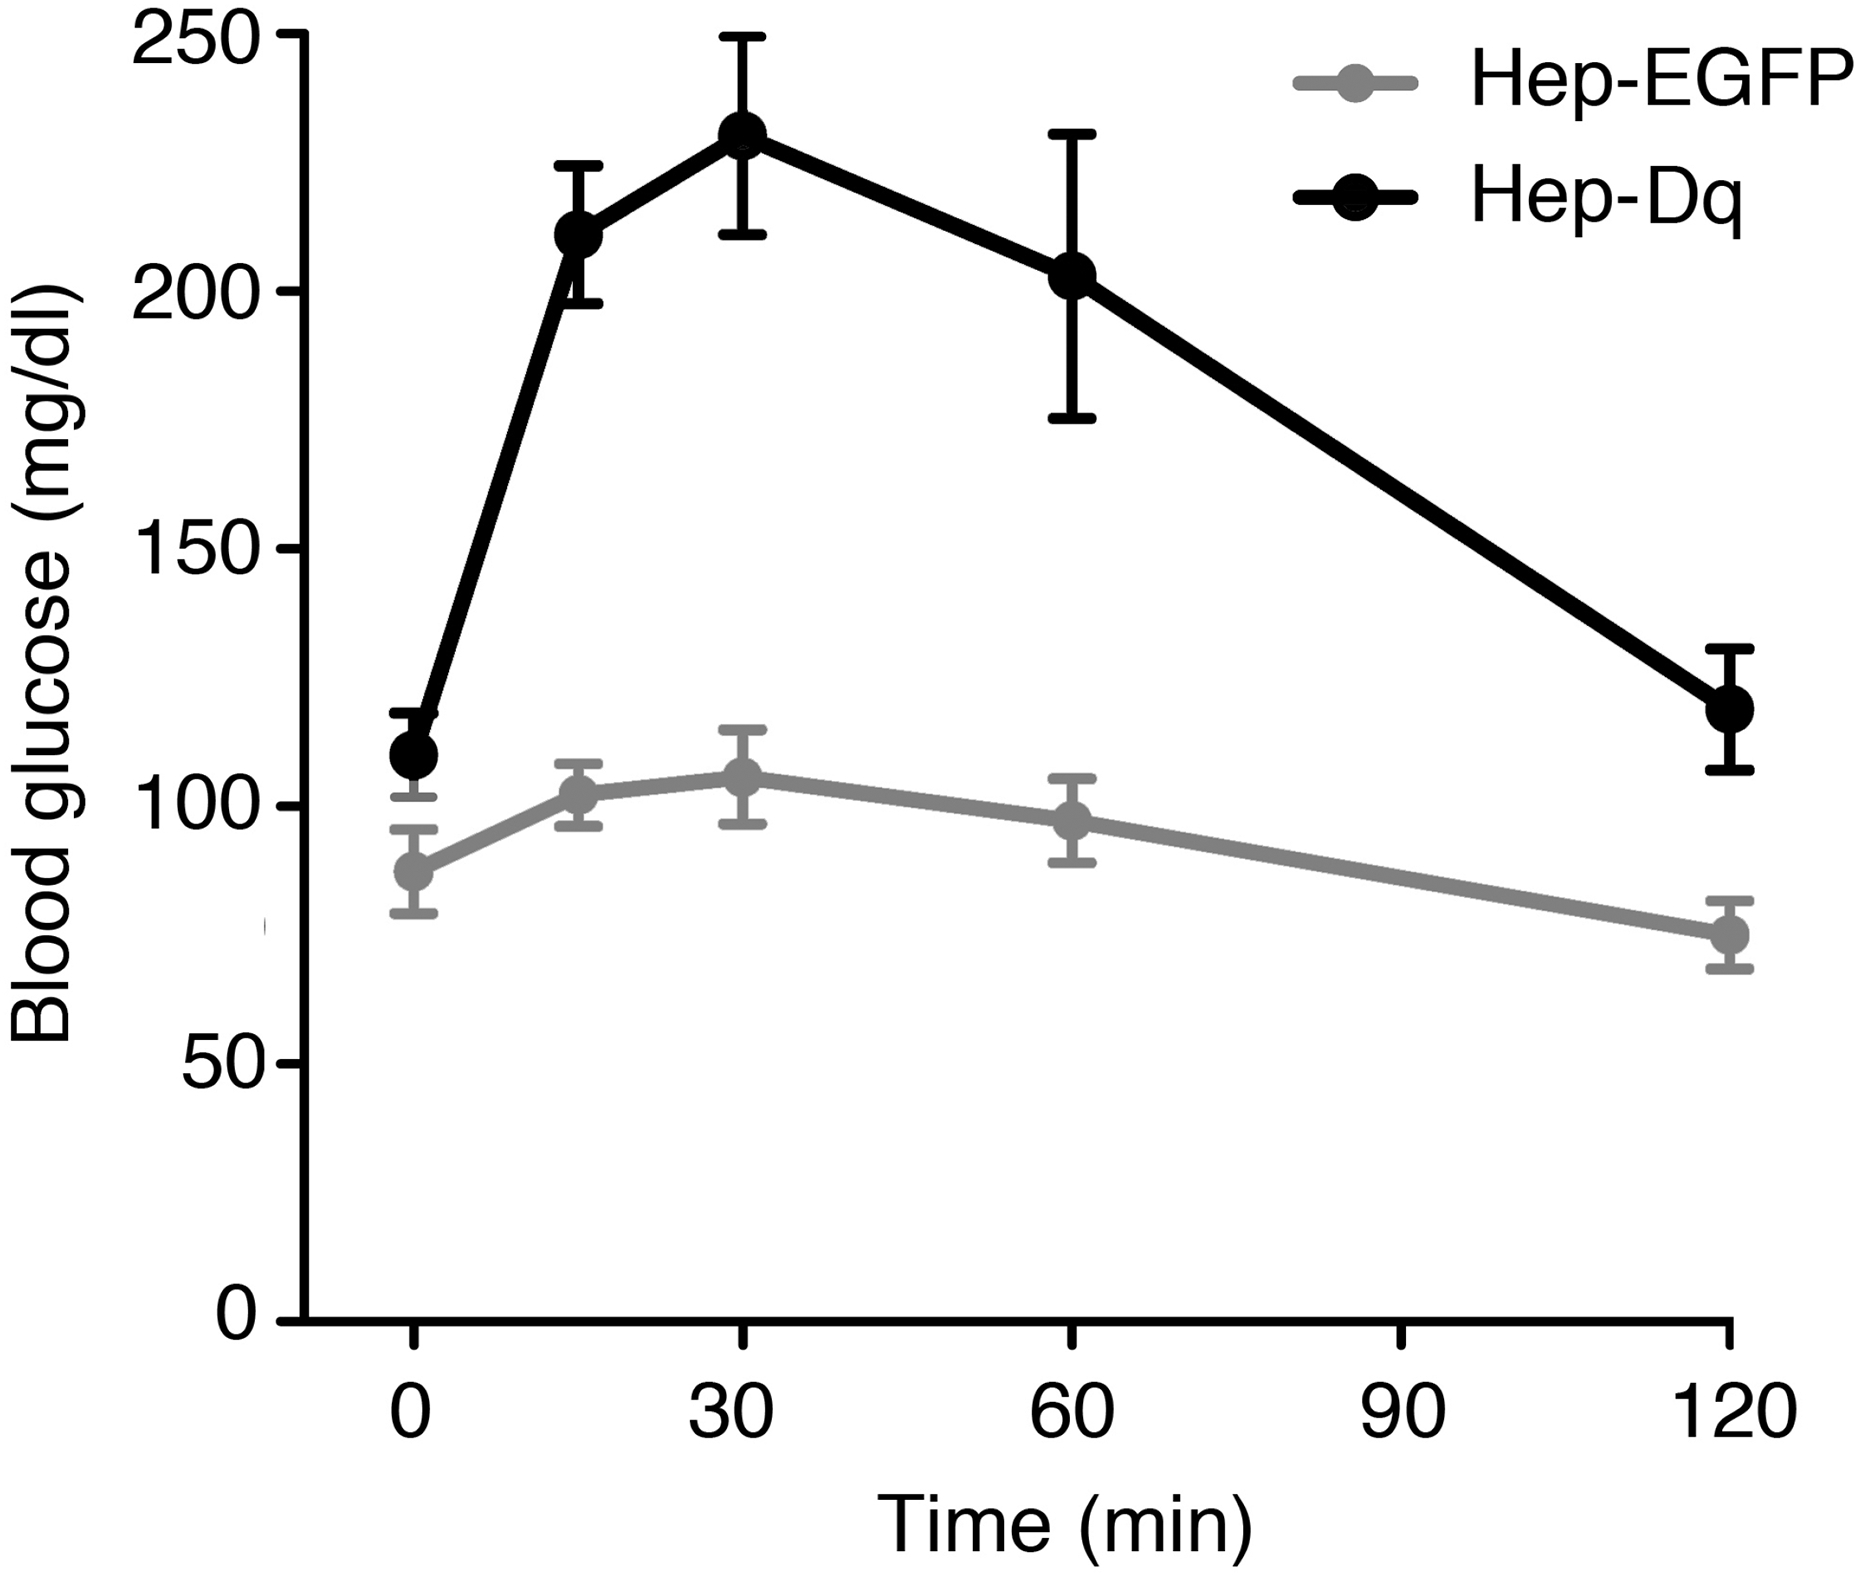
CNO treatment of Hep-Dq mice leads to pronounced increases in blood glucose levels. Using AAV technology (see text for details), we generated mice that expressed either Dq or EGFP selectively in hepatocytes (Hep-Dq and Hep-EGFP control mice, respectively). Male mice (genetic background: C57BL/6; age: ~12 weeks) that had been fasted overnight for 12 hr received a single injection of CNO (10 mg/kg i.p.), and blood glucose levels were measured at the indicated time points (M. Rossi, et al., unpublished results). Data are given as means ± SEM (n=8 per group).
4. Notes
The major disadvantage associated with the use of AAV vectors is the small genome, which limits the size of the transgene to about 4.5 Kb.
When using AAVs as a vehicle for protein expression in mice, it is important to consider AAV serotype, since different AAV serotypes show different tissue preferences (6).
The pAAV-hSyn-DIO-hM3Dq-mcherry plasmid (8) contains the Dq coding sequence (based on the human M3 muscarinic receptor sequence) (2). The C-terminus of Dq is fused to the mcherry coding sequence (resulting in Dq-mcherry) to facilitate Dq localization studies. Dq expression is under the transcriptional control of the human synapsin promoter and only occurs in the presence of Cre recombinase (for details, see Fig. 2). The plasmid is available from Addgene (https://www.addgene.org/;Addgene plasmid # 44361; deposited by Bryan Roth’s lab, UNC).
The pAAV-hSyn-DIO-hM3Dq-mcherry construct may be subject to recombination events due to the presence of ITR sequences (Fig. 2). The use of Stbl3 cells reduces the likelihood of such events.
Aliquots of the AAV-hSyn-DIO-hM3Dq-mcherry virus and other DREADD DIO AAVs can also be obtained from the UNC Vector Core (Chapel Hill, NC; http://www.med.unc.edu/genetherapy/vectorcore).
The anatomical accuracy of AAV injections is essential for the success of this experiment. Properly calibrate the X, Y and Z directions of the stereotaxic device and frequently confirm the calibration accuracy.
To prevent tissue damage near the injection site, use a slow injection speed. To avoid clogging of the needle, spin the AAV preparation at 10,000 × g for 1 to 2 min and use the supernatant (debris is in the pellet).
After injections, always pull up the needle slowly to prevent the injected virus to leak back into the needle track (suction effect).
Proper post-surgery animal care is the key to get accurate results.
Before surgery, re-confirm the genotype of the mouse to be injected. After the conclusion of phenotyping studies, confirm the proper expression of Dq (or any other DREADD), e.g. via immunohistochemistry (ICH; see below). Ideally, this should be done for each individual mouse.
CNO activation of Dq in AgRP neurons promotes the expression of c-fos (8), indicative of increased neuronal activity.
Use red pseudocolor to visualize mCherry (Dq-mcherry) expression and green pseudocolor to visualize c-fos expression, respectively (for colocalization studies).
When a mouse weighs 20 g, inject 200 μl of CNO solution (1 mg/kg i.p.).
Mice recover from isoflurane anesthesia usually within 1 min.
SURE cells are deficient in E. coli genes involved in the rearrangement and deletion of DNA, thus reducing the likelihood of recombination events due to the presence of the ITR sequences in the AAV-TBG-MCS plasmid.
Alternatively, AAV-TBG-Dq viral particles can be generated by an outside company/facility. We routinely use the services of The University of Pennsylvania Vector Core Facility (http://www.med.upenn.edu/gtp/vectorcore/). The AAV-TBG-eGFP control virus (cat # AV-8-PV0146) can also be obtained from this facility.
We routinely work with AAVs of serotype 8 which are very efficient in infecting hepatocytes. To prevent DREADD expression in cells other than hepatocytes, we take another precaution by placing DREADD expression under the transcriptional control of the hepatocyte-specific TBG (thyroxine-binding globulin) promoter (Fig. 5).
Mice should be at least 8 weeks old (younger mice are more difficult to inject). C57BL/6 mice are considered the standard strain for mouse metabolic studies.
Injections should be carried out with freely fed and fasted mice, to study effects on hepatic glucose fluxes under different experimental conditions (fed and fasting mice differ in many important metabolic parameters, including the activity of enzymes regulating glycogen metabolism and gluconeogenesis).
Acknowledgements
This work was supported by the Intramural Research Program of the National Institute of Diabetes and Digestive and Kidney Diseases (NIDDK), NIH. We thank Ms. Yinghong Cui and Mr. Matthew Stern for excellent technical support. We are also very grateful to the following three individuals who generously shared their expertise and many valuable reagents with us: Dr. Bryan L. Roth (The University of North Carolina, Chapel Hill, NC), Dr. Michael Krashes (NIDDK, NIH, Bethesda, MD), and Dr. Morris J. Birnbaum (The University of Pennsylvania, Philadelphia, PA).
References
- 1.Regard JB, Sato IT, and Coughlin SR (2008) Anatomical profiling of G protein-coupled receptor expression. Cell 135, 561–571. [DOI] [PMC free article] [PubMed] [Google Scholar]
- 2.Armbruster BN, Li X, Pausch MH, Herlitze S, Roth BL (2007) Evolving the lock to fit the key to create a family of G protein-coupled receptors potently activated by an inert ligand. Proc Natl Acad Sci USA 104, 5163–5168. [DOI] [PMC free article] [PubMed] [Google Scholar]
- 3.Wess J, Nakajima K, and Jain S (2013) Novel designer receptors to probe GPCR signaling and physiology. Trends Pharmacol Sci 34, 385–392. [DOI] [PMC free article] [PubMed] [Google Scholar]
- 4.Urban DJ and Roth BL (2014) DREADDs (designer receptors exclusively activated by designer drugs): chemogenetic tools with therapeutic utility. Annu Rev Pharmacol Toxicol [Epub] DOI: 10.1146/annurev-pharmtox-010814-124803 [DOI] [PubMed] [Google Scholar]
- 5.Guettier JM, Gautam D, Scarselli M, Ruiz de Azua I, Li JH, Rosemond E, Ma X, Gonzalez FJ, Armbruster BN, Lu H, Roth BL, and Wess J (2009) A chemical-genetic approach to study G protein regulation of beta cell function in vivo. Proc Natl Acad Sci USA 106, 19197–19202. [DOI] [PMC free article] [PubMed] [Google Scholar]
- 6.Zincarelli C, Soltys S, Rengo G, and Rabinowitz JE (2008) Analysis of AAV serotypes 1–9 mediated gene expression and tropism in mice after systemic injection. Mol Ther 16, 1073–1080. [DOI] [PubMed] [Google Scholar]
- 7.Aponte Y, Atasoy D, and Sternson SM (2011) AGRP neurons are sufficient to orchestrate feeding behavior rapidly and without training. Nat Neurosci 14, 351–355. [DOI] [PMC free article] [PubMed] [Google Scholar]
- 8.Krashes MJ, Koda S, Ye C, Rogan SC, Adams AC, Cusher DS, Maratos-Flier E, Roth BL, and Lowell BB (2011). Rapid, reversible activation of AgRP neurons drives feeding behavior in mice. J. Clin. Invest 121, 1424–1428. [DOI] [PMC free article] [PubMed] [Google Scholar]
- 9.Cansell C, Denis RG, Joly-Amado A, Castel J, Luquet S. (2012) Arcuate AgRP neurons and the regulation of energy balance. Front Endocrinol (Lausanne) 3, 169, eCollection 2012. [DOI] [PMC free article] [PubMed] [Google Scholar]
- 10.Krashes MJ, Shah BP, Koda S, and Lowell BB (2013). Rapid versus delayed stimulation of feeding by the endogenously released AgRP neuron mediators GABA, NPY, and AgRP. Cell Metab 18, 588–595. [DOI] [PMC free article] [PubMed] [Google Scholar]
- 11.Atasoy D, Betley JN, Su HH, and Sternson SM (2012) Deconstruction of a neural circuit for hunger. Nature 488, 172–177. [DOI] [PMC free article] [PubMed] [Google Scholar]
- 12.Krashes MJ, Shah BP, Madara JC, Olson DP, Strochlic DE, Garfield AS, Vong L, Pei H, Watabe-Uchida M, Uchida N, et al. (2014) An excitatory paraventricular nucleus to AgRP neuron circuit that drives hunger. Nature 507, 238–242. [DOI] [PMC free article] [PubMed] [Google Scholar]
- 13.Cardin JA, Carlen M, Meletis K, Knoblich U, Zhang F, Deisseroth K, Tsai LH, and Moore CI (2009) Driving fast-spiking cells induces gamma rhythm and controls sensory responses. Nature 459, 663–667. [DOI] [PMC free article] [PubMed] [Google Scholar]
- 14.Atasoy D, Aponte Y, Su HH, and Sternson SM (2008) A FLEX switch targets Channelrhodopsin-2 to multiple cell types for imaging and long-range circuit mapping. J Neurosci 28, 7025–7030. [DOI] [PMC free article] [PubMed] [Google Scholar]
- 15.Grieger JC, Choi VW, and Samulski RJ (2006) Production and characterization of adeno-associated viral vectors. Na. Protocols 1, 1412–1428. [DOI] [PubMed] [Google Scholar]
- 16.Tong Q, Ye CP, Jones JE, Elmquist JK, and Lowell BB (2008) Synaptic release of GABA by AgRP neurons is required for normal regulation of energy balance. Nat Neurosci 11, 998–1000. [DOI] [PMC free article] [PubMed] [Google Scholar]
- 17.Lin HV and Accili D (2011) Hormonal regulation of hepatic glucose production in health and disease. Cell Metab 14, 9–19. [DOI] [PMC free article] [PubMed] [Google Scholar]
- 18.Nakajima K and Wess J (2012) Design and functional characterization of a novel, arrestin-biased designer G protein-coupled receptor. Mol Pharmacol 82, 575–582. [DOI] [PMC free article] [PubMed] [Google Scholar]
- 19.Li JH, Jain S, McMillin SM, Cui Y, Gautam D, Sakamoto W, Lu H, Jou W, McGuinness OP, Gavrilova O, and Wess J (2013) A novel experimental strategy to assess the metabolic effects of selective activation of a Gq-coupled receptor in hepatocytes in vivo. Endocrinology 154, 3539–3551. [DOI] [PMC free article] [PubMed] [Google Scholar]


