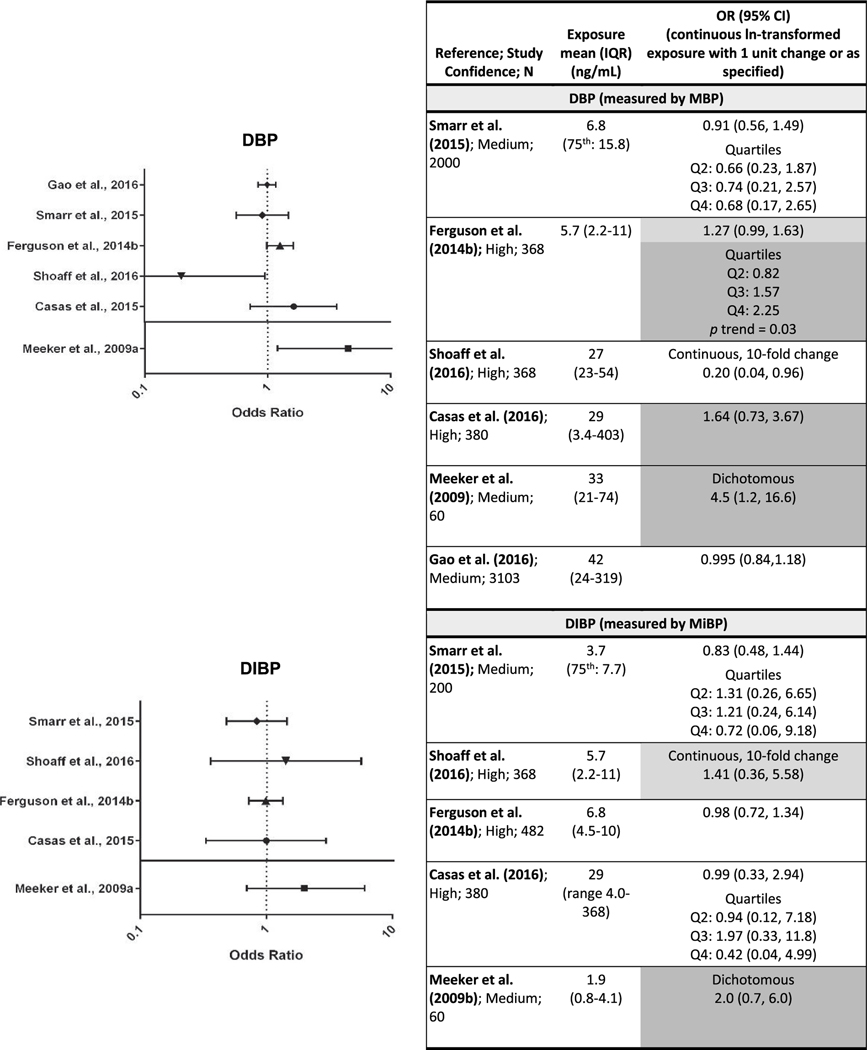
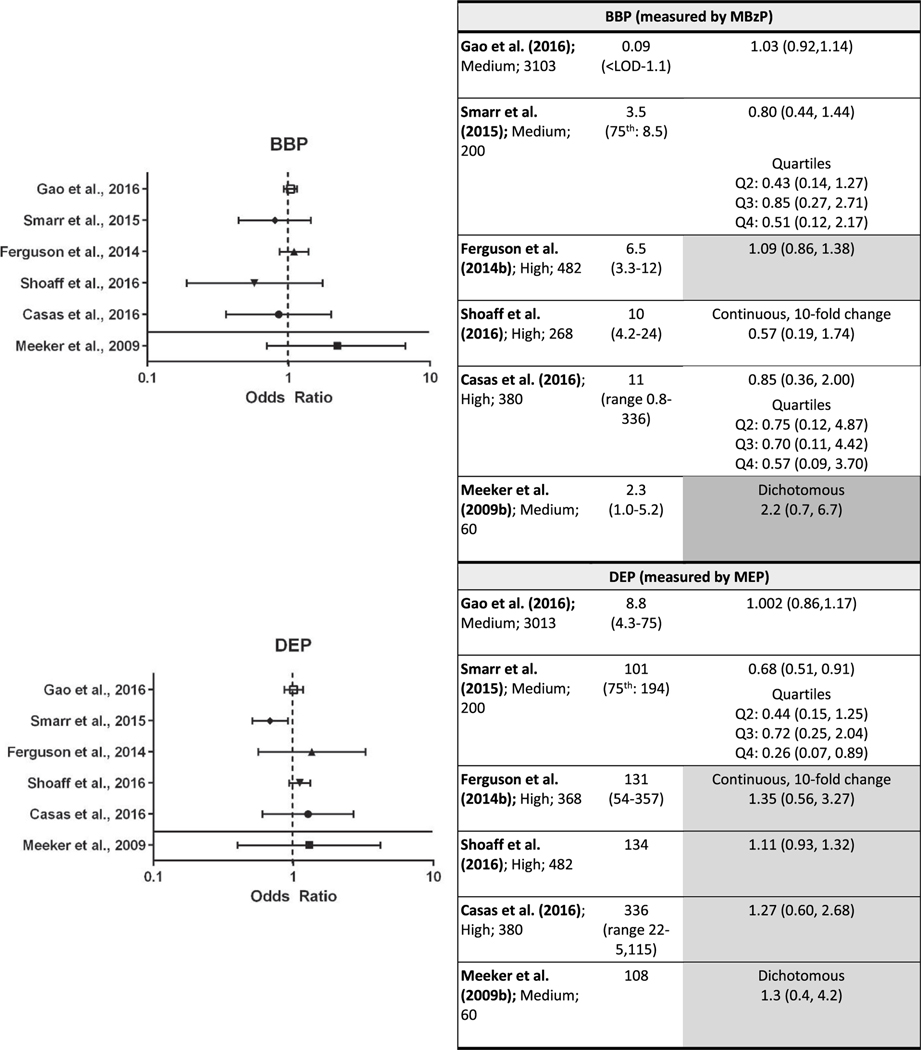
Fig. 3.
Association between exposure to DBP, DIBP, BBP, and DEP and preterm birth.
Each panel depicts results for a metabolite(s) from a different parent phthalate; Q= quartile.
*p < 0.05, results that support an association are shaded. Dark gray represents one or more of the following: p < 0.05, large effect size (e.g., OR ≥ 1.5), or exposure-response trend across categories of exposure. Light gray represents other supportive results.
Tables are sorted within individual phthalates by median exposure level.


