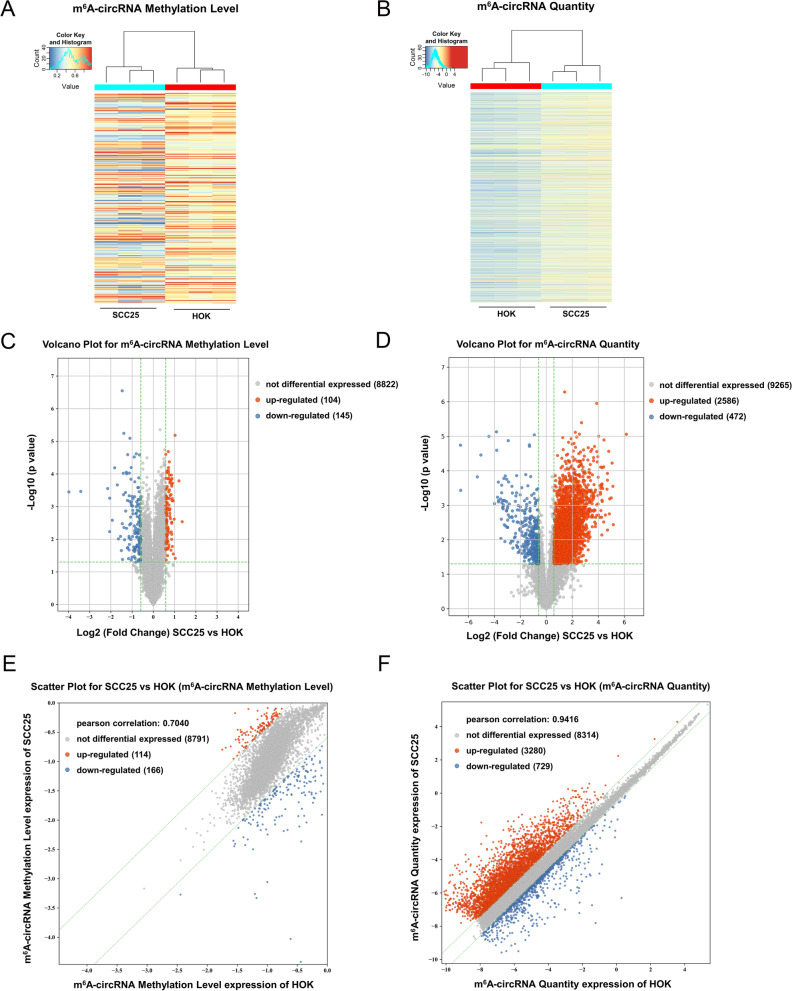
Fig. 1.
m6A-circRNA epitranscriptomic microarray analysis revealed the m6A- circRNAs profile in OSCC. A, B Heat Map showed the differentially expressed m6A-circRNAs, including ‘m6A-circRNA Methylation Level’ and ‘m6A-circRNA Quantity’. OSCC cells were SCC25 cells and normal cells were HOK cells. C, D Volcano Plot showed the differentially expressed m6A-circRNAs. Based on this threshold (p-value < 0.05, fold change > 1.5 fold), there were 104 up-regulated m6A-circRNA and 145 down-regulated m6A-circRNA on the basis of ‘m6A-circRNA Methylation Level’ (C). And, there were 2586 up-regulated m6A-circRNA and 472 down-regulated m6A-circRNA on the basis of ‘m6A-circRNA Quantity’ (D). E, F Scatter Plot displayed the correlation distribution of m6A-circRNA in SCC25 cells and HOK cells

