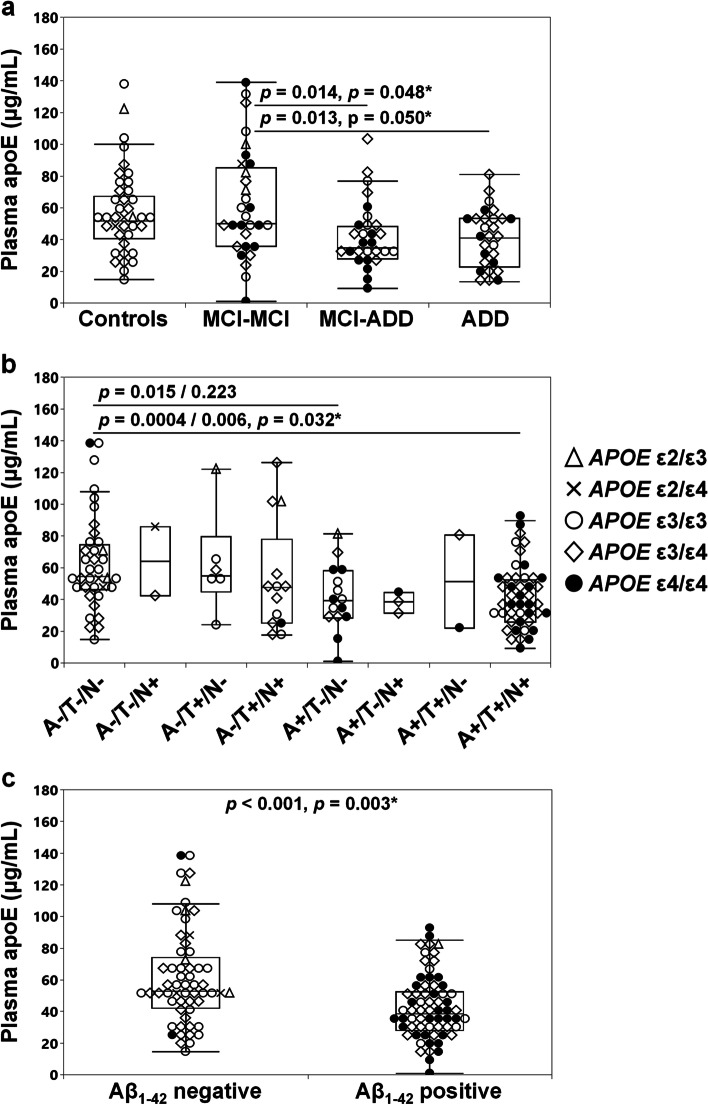
Fig. 3.
Plasma apoE levels per diagnostic group. Plasma apoE levels in controls, MCI-MCI, MCI-ADD and ADD patients (a) and in groups based on the A/T/N classification (b) and the Aβ1-42 status (c). Data is presented as median (minimum–maximum). Group differences were assessed using ANOVA (Tukey HSD post hoc) (a), the Kruskal–Wallis test followed by the Dunn’s test uncorrected/corrected for multiple comparisons using Bonferroni correction (b), or Mann–Whitney U test (c). Star marked p-values obtained after accounting for the APOE genotype of the studied subjects. The A-/T-/N + and A + /T + /N- groups were excluded from the statistical analysis due to low n-numbers (n = 2, in each group)

