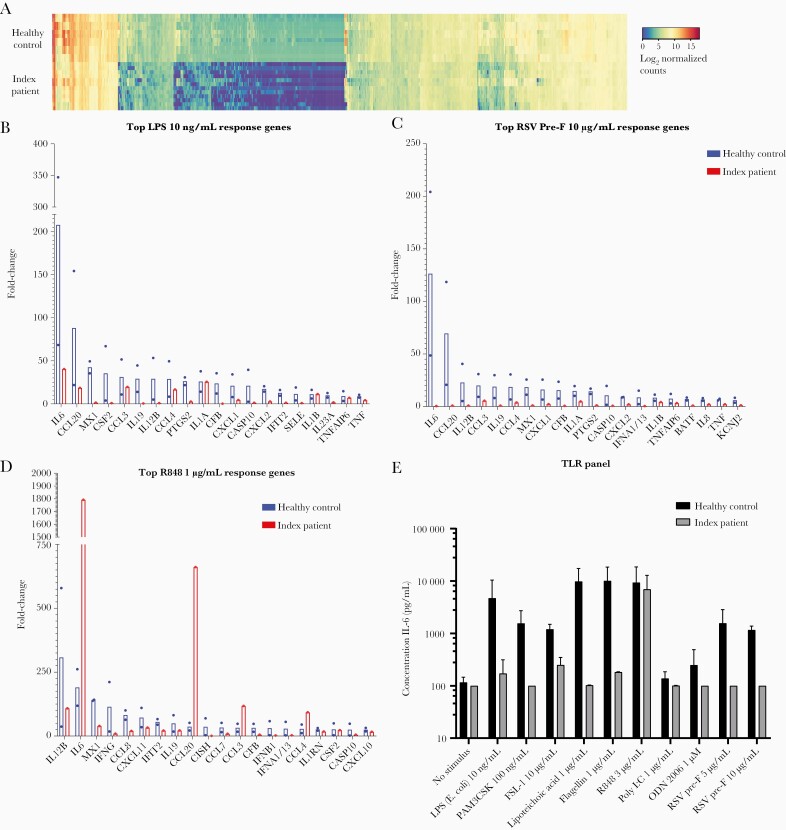
Figure 3.
Impaired innate immune response to Toll-like receptor (TLR) 1/2, 2/6, 4, and 5 stimulation in CD14 deficiency. (a) Gene expression by peripheral blood mononuclear cells (PBMCs) after 4 hours of stimulation with a panel of TLR ligands, quantified using NanoString Technology. Log2 normalized counts are represented for the index patient (top) and a healthy control (bottom). Upregulated genes are depicted in gray, and downregulated genes are depicted in black. Each row represents a stimulus. Each column represents 1 gene. In Supplemental Figure S9, a large version of the heatmap can be found. (b–d) Expression of the top 20 response genes measured in a, after stimulation with lipopolysaccharide (LPS) (Escherichia coli [E. coli]) (10 ng/mL), R848 (1 µg/mL), and respiratory syncytial virus (RSV)-pre-fusion (pre-F) (10 µg/mL). Fold change compared with unstimulated is shown for a healthy control ([HC] black bars) and the index patient (gray bars). (e) Interleukin (IL)-6 protein expression by patient and control PBMCs (n = 4 donors) after TLR stimulation. Values show the mean + standard deviation of 2 independent experiments.

