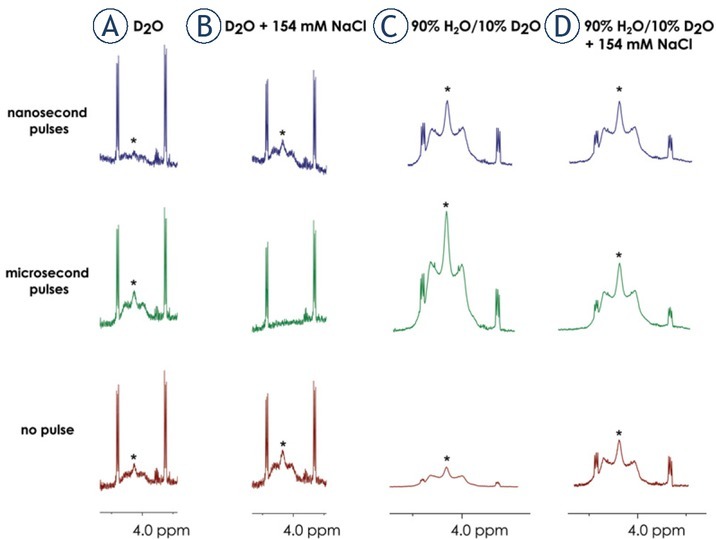
Figure 4.

1H NMR spectra of cisplatin, showing the signals for hydrogens of NH3 ligands labeled with asterisks (*). Spectra were recorded in a) D2O, b) D2O containing 154 mM NaCl, c) 90% H2O/10% D2O and d) 90% H2O/10% D2O containing 154 mM NaCl treated with 25 × 400 ns pulses (blue), 8 × 100 μs pulses (green) or no pulses (red).
