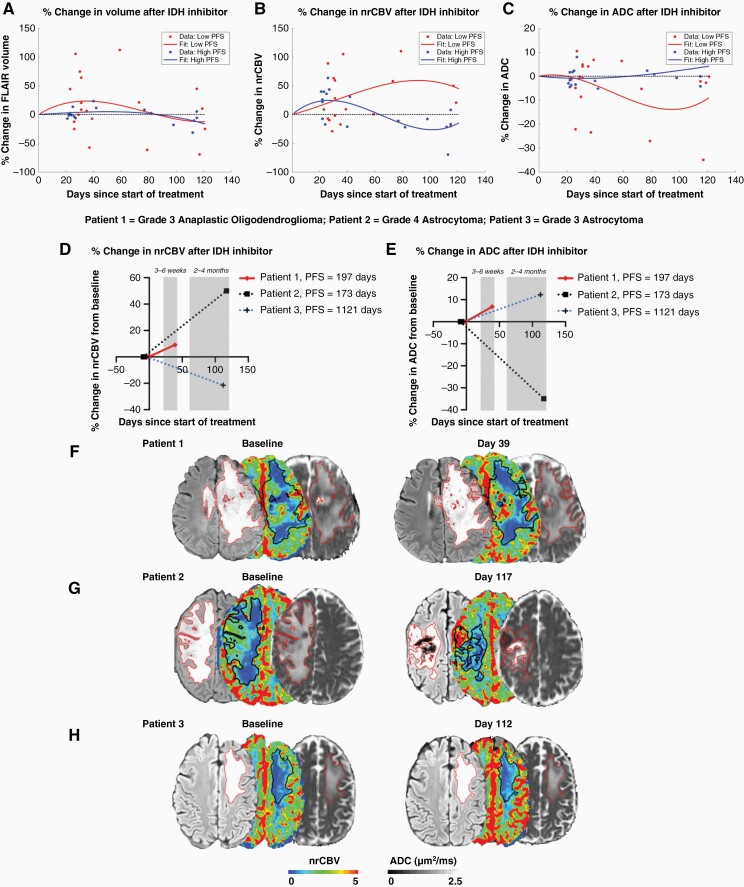
Figure 2.
Temporal trends of FLAIR volume, nrCBV, and ADC changes following IDH inhibitor and three representative cases. Local polynomial regression trend lines (A–C) depict an early rise in nrCBV following IDH inhibitor across patients followed by increased nrCBV at later timepoints associated for the low PFS group. ADC differences appear at later timepoints with the low PFS group exhibiting decreased ADC. FLAIR volume also generally increases early in treatment. Patient 1 (F) is a grade 3 anaplastic oligodendroglioma with a large increase in nrCBV after day 39 of AG-120 treatment and presented with a PFS of around 197 days. For the 2–4-month timepoint cases, Patient 2 (G) is a grade 4 astrocytoma that demonstrated an increase in nrCBV and a decrease in ADC after day 117 of AG-120 treatment and presented with a PFS of around 173 days. Patient 3 (H) is a grade 3 astrocytoma who exhibited a small decrease in nrCBV and small increase in ADC after day 112 of AG-120 treatment. Patient 3 had a longer PFS of 1121 days. IDH, isocitrate dehydrogenase; nrCBV, normalized relative cerebral blood volume; PFS, progression-free survival.

