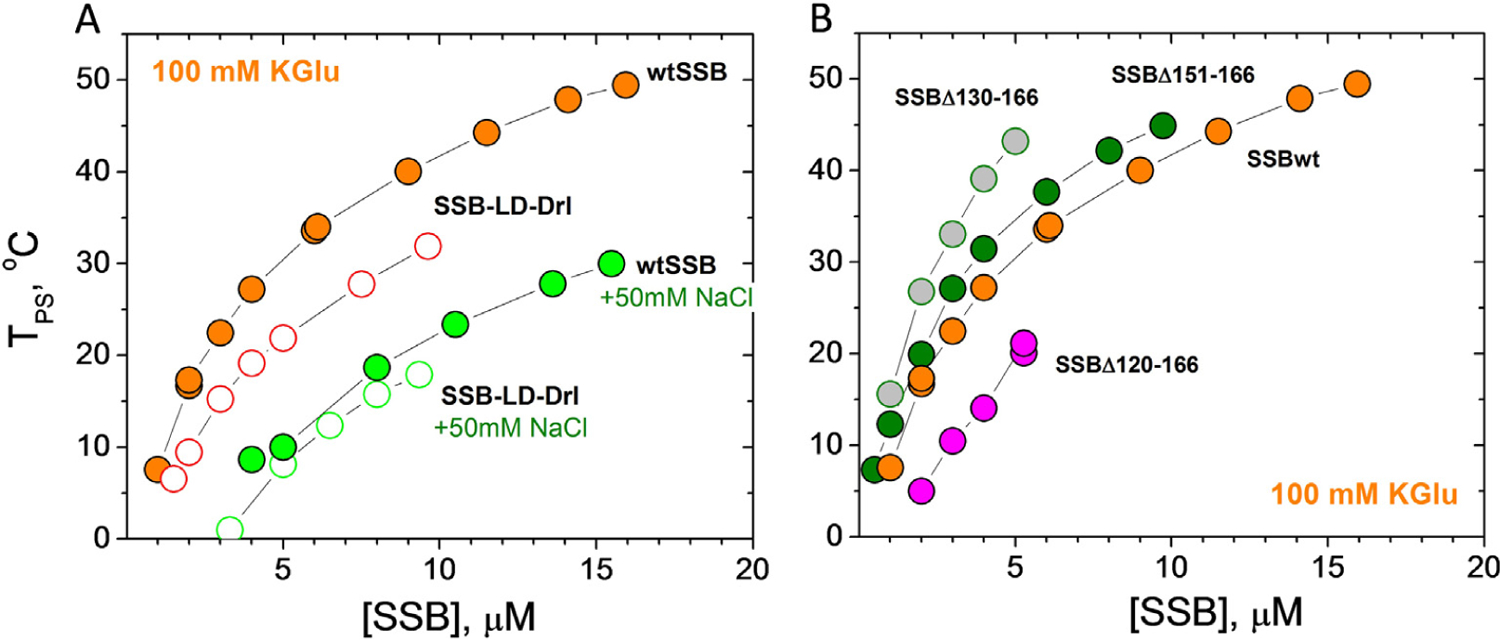
Figure 4. Number of tails and IDL deletions affect EcSSB LLPS.

SSB liquid–liquid phase diagrams (TPS vs [SSB], buffer T, 0.1 M KGu) obtained for: (A) - two tailed SSB-LD-Drl (open orange circles) and (B) - SSB with IDL deletions, Δ151–166 (green), Δ130–166 (grey), Δ120–166 (magenta). Phase diagrams of wtSSB for the same conditions are shown for comparison, including the effect of addition of 50 mM NaCl (panel A, green circles for wtSSB and open green circles for SSB-LD-Drl).
