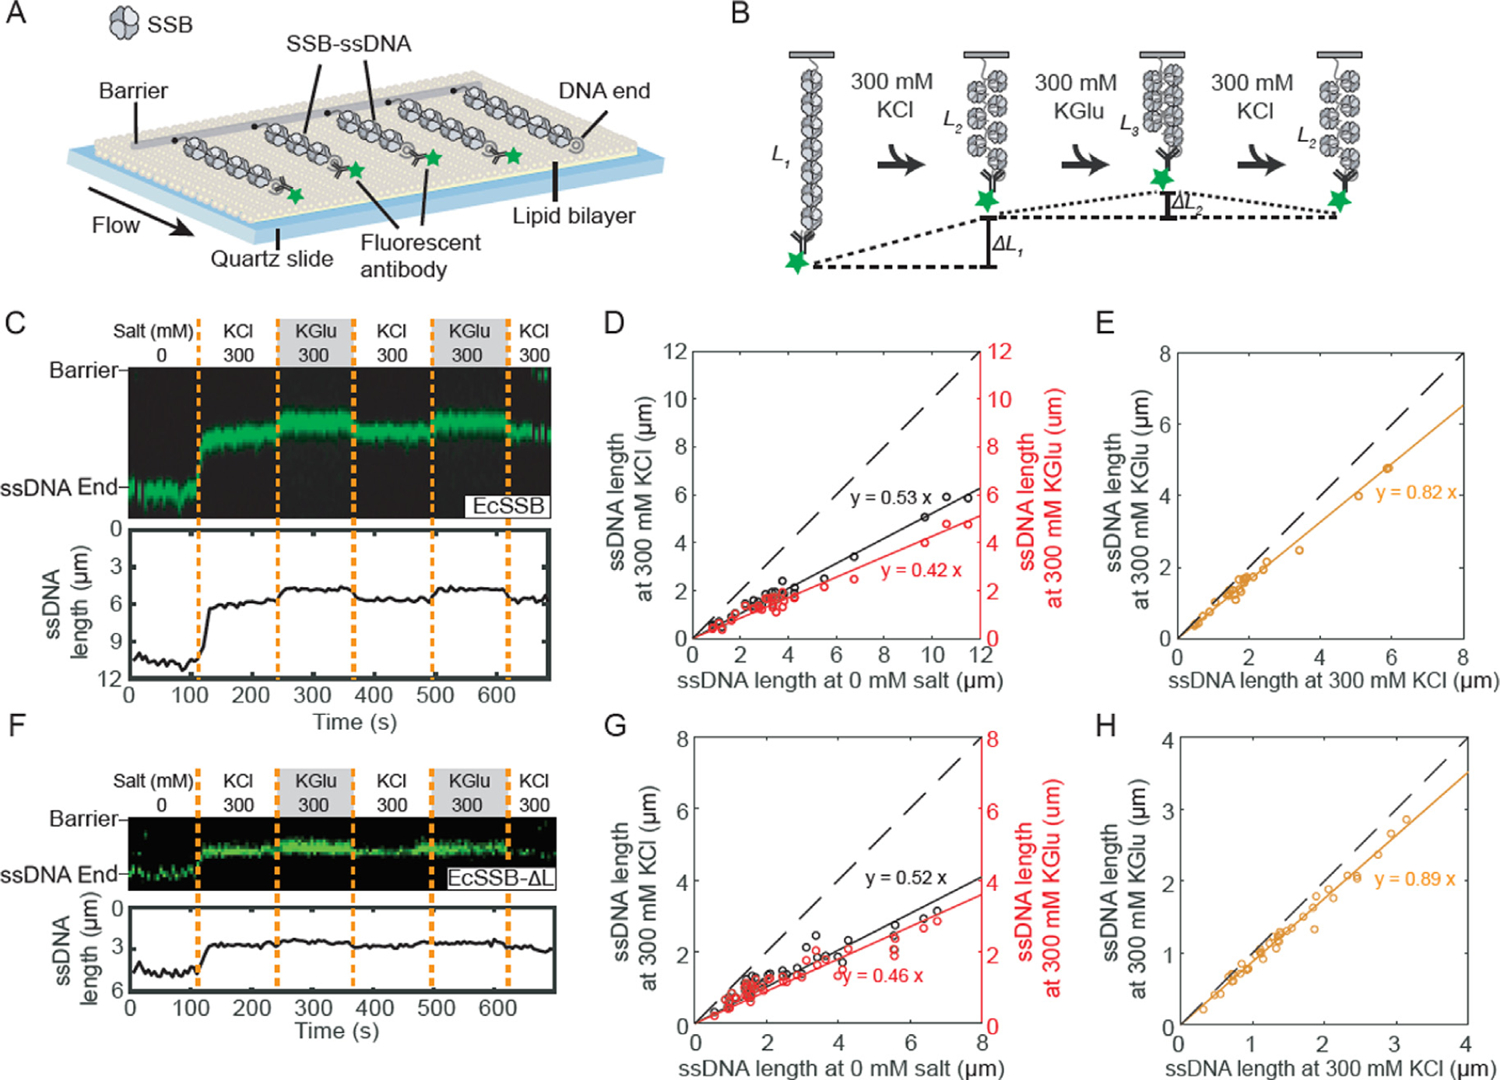
Figure 5. Glutamate promotes additional compaction of single polymeric DNA molecules coated with SSB.

(A) Illustration of ssDNA curtains decorated with SSB. (B) Schematic of the salt exchange assay. The length of SSB-ssDNA is changed when different buffer is loaded. (C) Representative kymograph (top) and single-particle tracking (bottom) showing the compaction of SSB-coated ssDNA end (green). Dashed orange lines denote when the buffer was switched. (D) Correlation between ssDNA-SSB lengths at 0 and 300 mM KCl (black), and at 0 and 300 mM KGlu (red). The solid lines are a linear fit to the data (N = 29 molecules). The dashed line represents a slope of 1. (E) Correlation between ssDNA-SSB lengths at 300 mM KCl and 300 mM KGlu (orange). (F) Representative kymograph and single-particle tracking showing the compaction of SSB-ΔL-coated ssDNA. (G) Correlation between length of ssDNA coated with EcSSB-ΔL at 0 and 300 mM KCl, and at 0 and 300 mM KGlu (N = 42 molecules). (H) Correlation between length of ssDNA coated with SSB-ΔL at 300 mM KCl and 300 mM KGlu.
