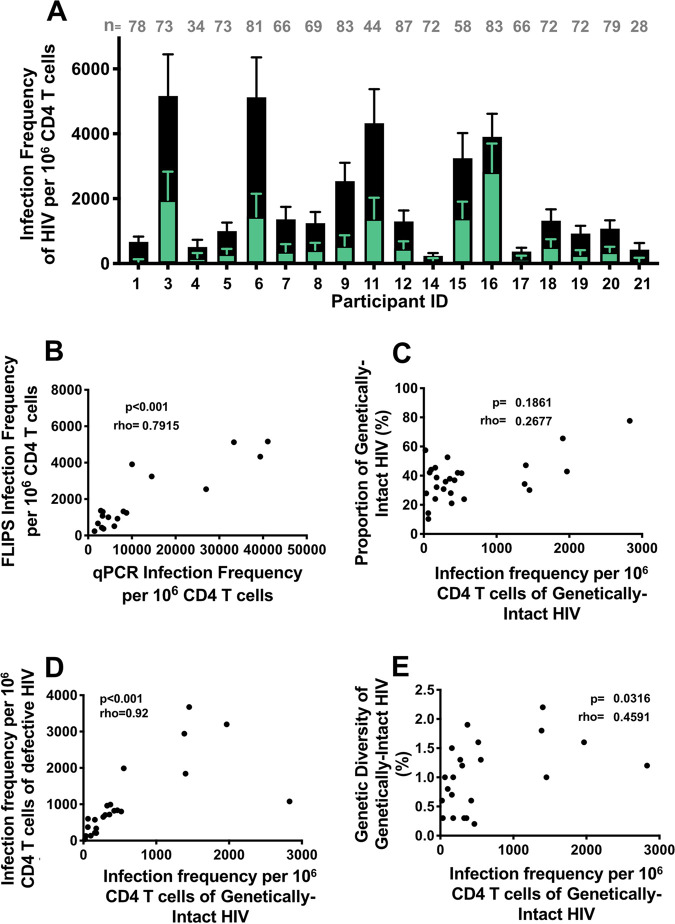
FIG 1.
(A) Infection frequency of HIV per 106 CD4+ T cells from pre-therapy samples from 18 HIV-HBV co-infected participants, where the frequency of genetically-intact HIV (in green) may also be viewed as a proportion of the total HIV frequency (in black). The number of HIV sequences obtained for each participant is denoted by n. (B) Spearman’s correlation between the infection frequency of the total HIV measured by qPCR and the infection frequency of HIV (genetically-intact and defective) measured by FLIPS. (C) Spearman’s correlation between the infection frequency of HIV proviruses with the proportion of genetically-intact HIV provirus. (D) Spearman’s correlation between the infection frequencies of genetically-intact and defective HIV proviruses. (E) Spearman’s correlation between the infection frequencies of genetically-intact HIV proviruses with the genetic diversity of genetically-intact HIV provirus.

