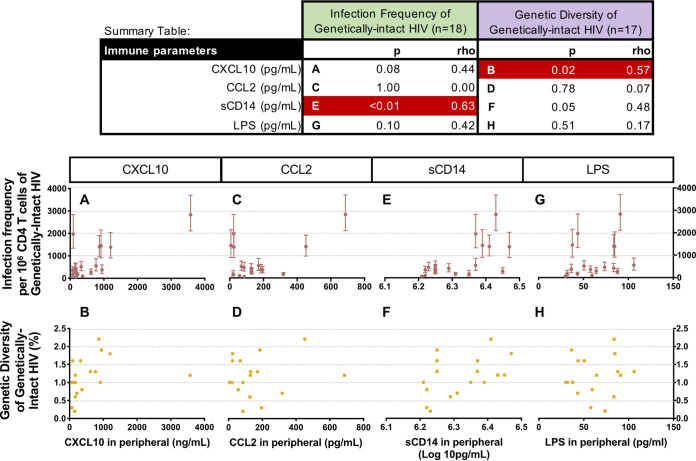
FIG 3.
Spearman’s correlation analyses comparing the levels of immune activation and inflammation markers with the infection frequency and the genetic diversity of genetically-intact HIV proviruses (Summary Table: significant associations in red). The association between the infection frequency (maroon) and the diversity (yellow) of genetically-intact HIV proviruses and the levels of immune markers are shown in Fig. 3A–H. The scale of the x-axis changes for each immune marker.

