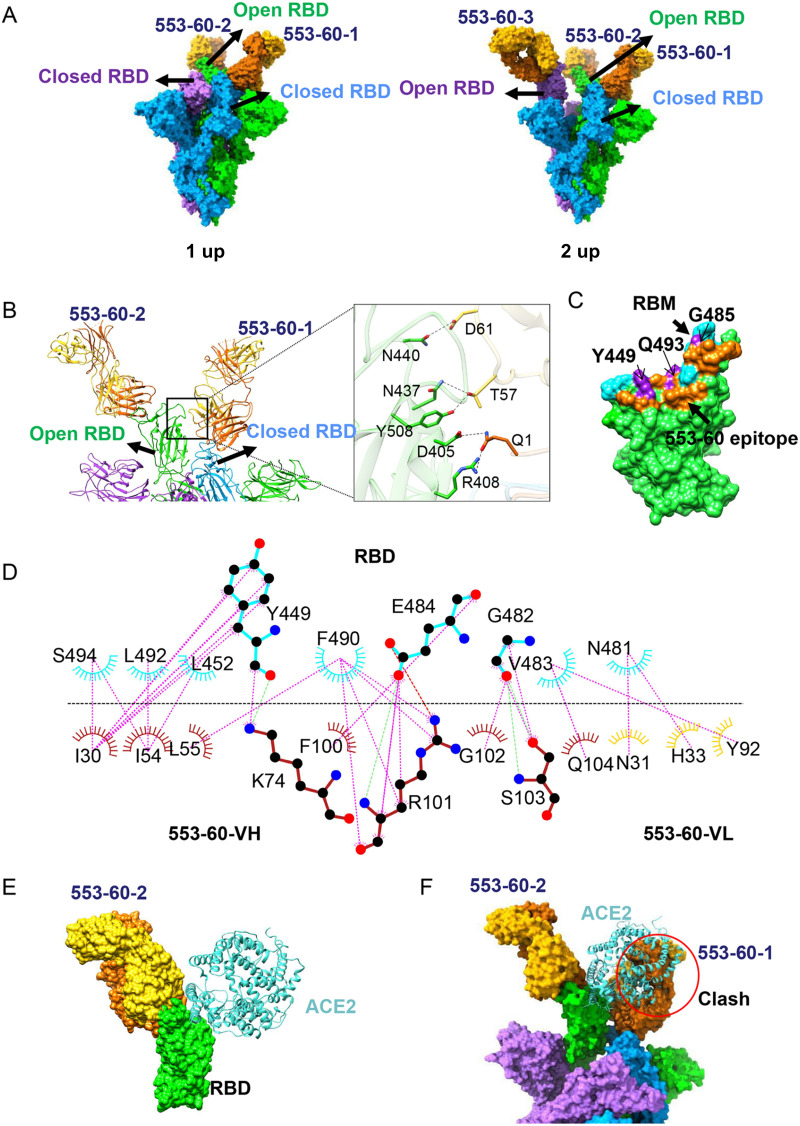
FIG 5.
Cryo-EM structure of the D614G S in complex with IgG 553-60. (A) Molecular-surface representation of S–553-60 structures in two states, with 1 up RBD and 2 up RBDs, respectively. (B) Ribbon and stick representations of two neighboring up and down RBDs, each interacting with one 553-60 Fab. Fab 553-60-1 interacts with both up and down RBDs, introducing additional contacts. (C) Surface representation of RBD showing the buried binding site, including 553-60 (orange), RBM (cyan), and 553-60 epitope overlaps with the RBM region (purple). (D) Two-dimensional representations showing the interaction between the RBD (cyan) and 553-60 (heavy chain, orange; light chain, gold). Hydrogen bonds are shown as light dashed lines. The interactions were analyzed by LigPlot (38). (E, F) Superimposition of RBD-553-60-2 with RBD-ACE2 (PDB 6LZG) complex structures revealed a minor clash between ACE2 and 553-60-2 (E) but a major clash between ACE2 and 553-60-1 Fab which binds to the neighboring down RBD (F).

