. 2022 Aug 1;13(33):9727–9738. doi: 10.1039/d2sc00525e

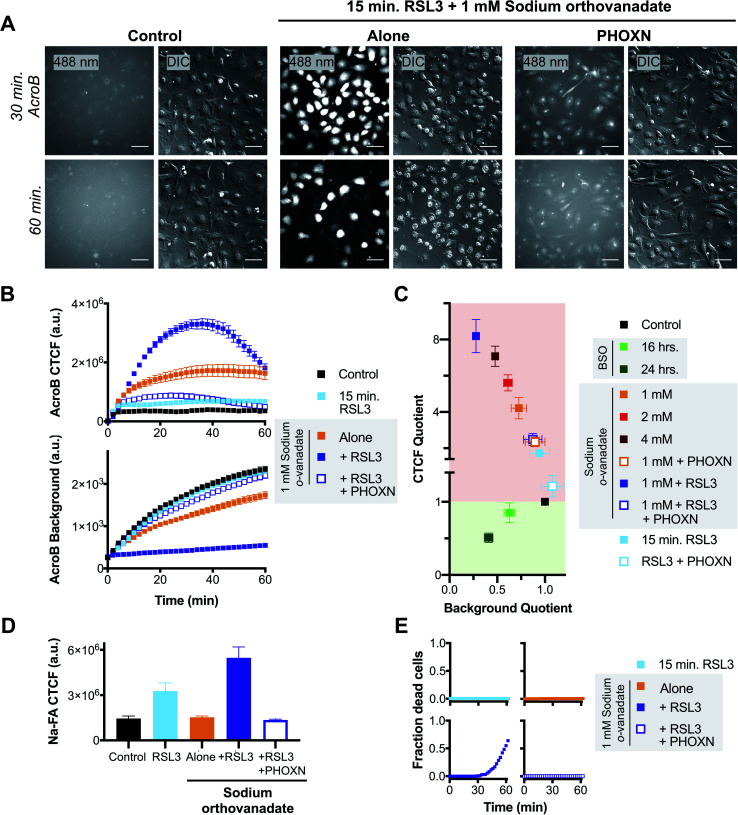
Fig. 4. Exacerbated electrophile export impairment during ferroptosis induction increases aldehyde accumulation and cell death. (A) Representative 20× widefield AcroB fluorescence and corresponding DIC images of HT-1080 cells with/without treatments with 1 μM PHOXN (30 min incubation), 1 mM sodium orthovanadate (30 min incubation) and 1 μM RSL3 (15 min incubation). Images acquired over 60 minutes following AcroB addition, LUT range 0–4000, scale bar is 64 μm. (B) Average AcroB CTCF and fluorescence background curves representing n = 11 FOV (control), n = 9 FOV (15 min RSL3), n = 10 FOV (1 mM sodium orthovanadate), n = 9 FOV (sodium orthovanadate + RSL3) and n = 10 FOV (sodium orthovanadate + RSL3 + PHOXN) obtained from 20× widefield fluorescence images. AcroB concentration = 100 nM. (C) ElectrophileQ plot constructed using values recorded 20 min after AcroB application for indicated conditions presented in (C) and Fig. S5. (D) Aldehyde probe Na-FA fluorescence levels (5 μM, 30 minute incubation) in HT-1080 cells after indicated treatments. Average of n = 5 FOV for all conditions. (E) Fraction of dead cells as determined by 20× widefield propidium iodide (10 μM) fluorescence imaging for indicated conditions. All values presented as mean ± SEM. λex = 488 nm (0.1 mW).

Fig. 4