Figure 3.

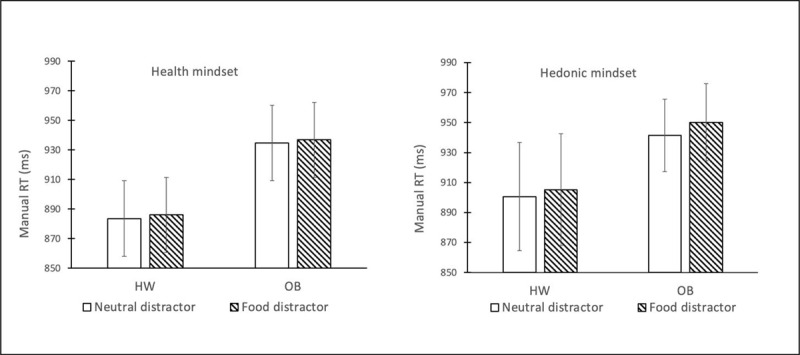
Average manual response latency per condition of the design. Error bars reflect 1 standard error of the mean in each direction. Abbreviations: HW = healthy-weight-category BMI; OB = obese BMI.

Average manual response latency per condition of the design. Error bars reflect 1 standard error of the mean in each direction. Abbreviations: HW = healthy-weight-category BMI; OB = obese BMI.