Figure 5.
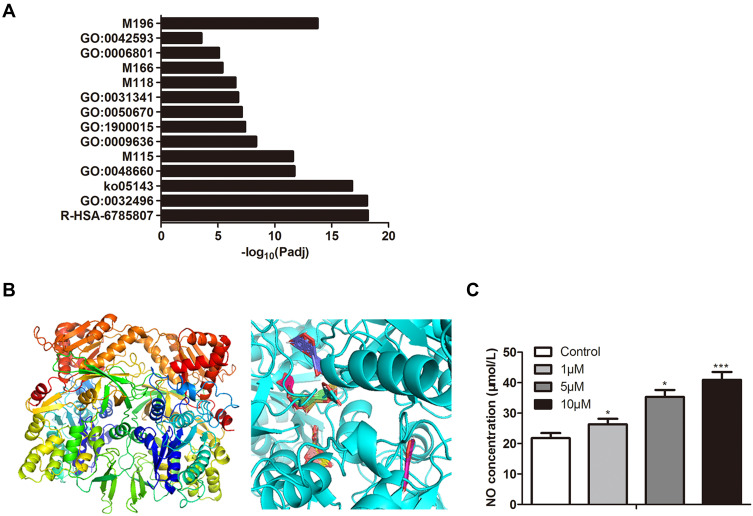
Predicting and validating targets for luteolin. (A) Results of GO enrichment analysis of the potential targets. (B) Molecular docking between luteolin and main targets. (C) Effect of different concentrations of luteolin on NO concentration. The values were presented as mean ± SD (n=3). *P<0.05 and ***P<0.001 versus the control group.

