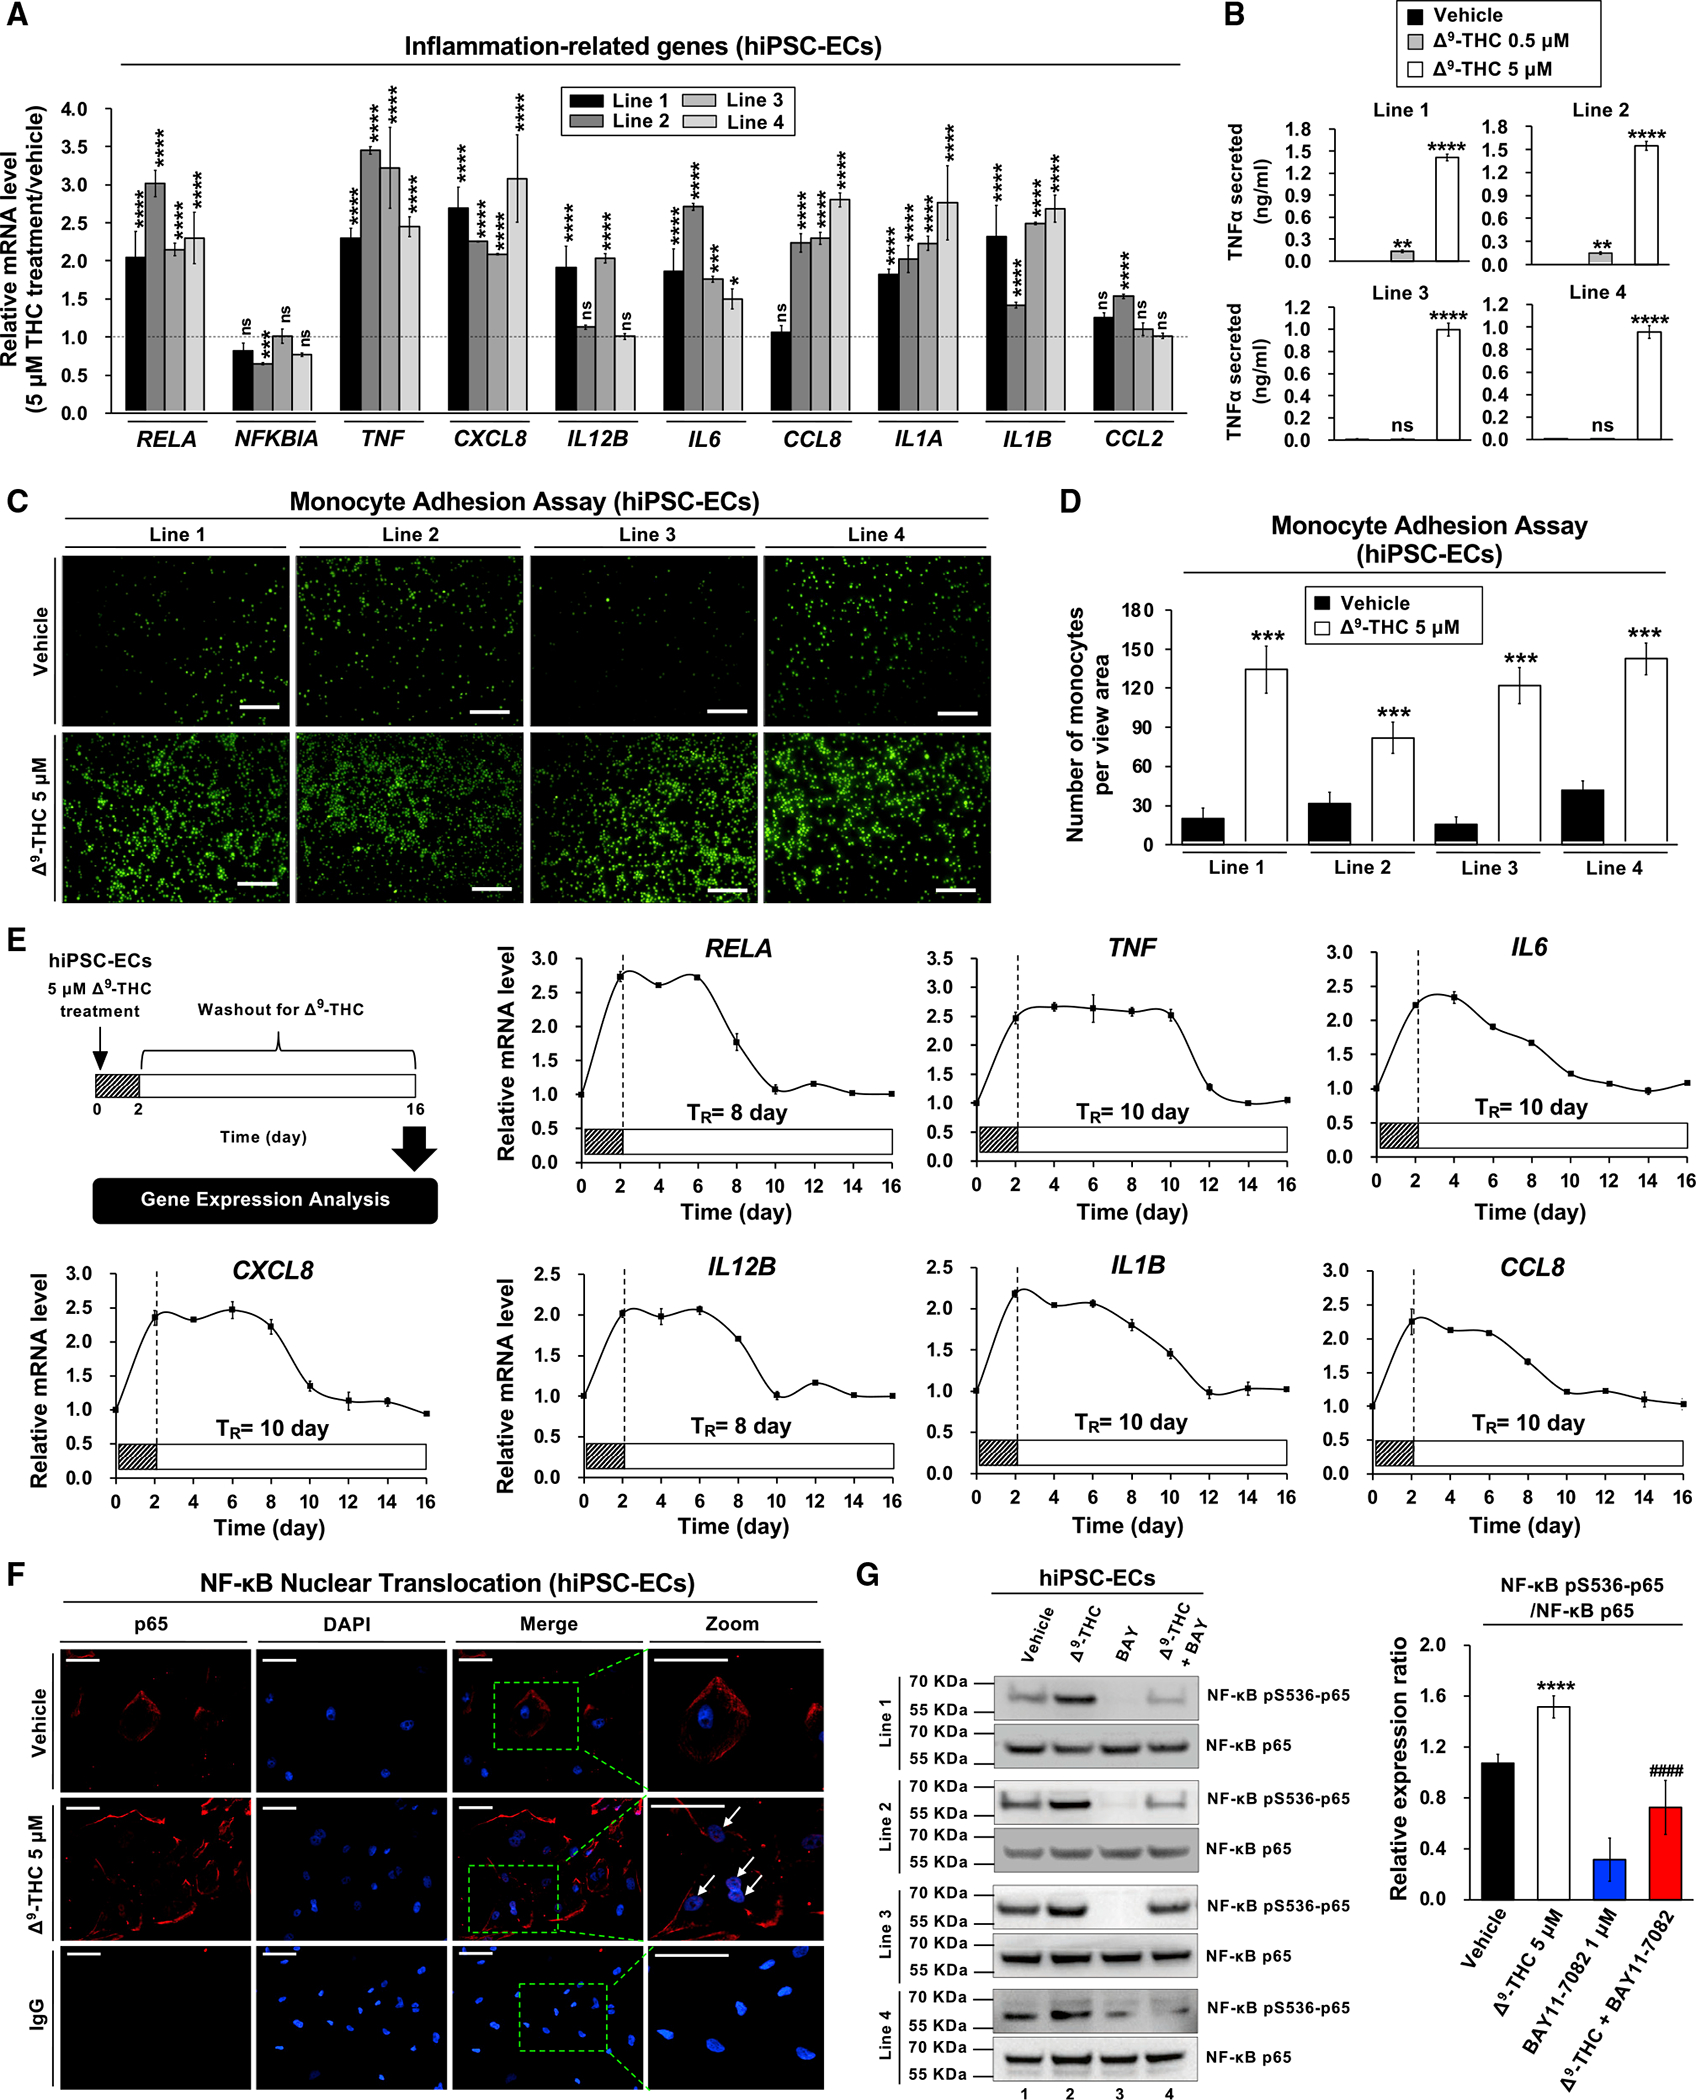
Figure 4. Δ9-THC causes inflammation in hiPSC-ECs, TNF-α release, and monocyte adhesion.

(A) RNA expression of inflammation-related genes in hiPSC-ECs after Δ9-THC treatment for 48 h, as determined by qPCR normalized to GAPDH.
(B) Δ9-THC promoted the release of TNF-α from hiPSC-ECs. Cells were treated with 0.5 or 5 μM Δ9-THC for 48 h, and TNF-α concentration in the cell culture medium was measured by ELISA.
(C) Monocyte adhesion assays of hiPSC-ECs treated with 5 μM Δ9-THC for 48 h. U937 adherence was observed by a fluorescence microscope.
(D) The intensity of fluorescence-labeled-adherent U937 monocytes was measured.
(E) The effect of Δ9-THC on the inflammation-related gene expression in hiPSC-ECs. Cells were treated with 5 μM Δ9-THC for 48 h. The medium was replaced with fresh cell culture medium, and total RNA was isolated from cells every other day for 14 days. Expression of inflammation-related genes was quantified by qPCR analysis and normalized to GAPDH. The retention time (TR) means the time required for the recovery of mRNA basal level.
(F) The effects of Δ9-THC on p65 nuclear translocation in hiPSC-ECs were determined in co-localization studies. hiPSC-ECs were treated with 5 μM Δ9-THC for 48 h and then assayed with anti-p65 antibody for localization of p65 (red fluorescence). The nuclei were counterstained with DAPI (blue fluorescence), and cells were visualized using immunofluorescence microscopy; merged images are shown. The white arrowhead indicates co-localization (purple) of p65 (red) and DAPI (blue) (scale bar, 50 μm).
(G) Δ9-THC caused p65 phosphorylation in hiPSC-ECs. Cells were treated with 5 μM Δ9-THC, 1 μM BAY11–7082, or their combination for 48 h. Western blot analysis was performed on total cell lysates using indicated antibodies (left panel). Images were quantified by ImageJ software (right panel). Error bars represent mean ± SEM. *p < 0.05 versus vehicle; **p < 0.01 versus vehicle; ***p < 0.001 versus vehicle; ****p < 0.0001 versus vehicle; ns, not significant versus vehicle; ####p < 0.0001 versus Δ9-THC.
