
Figure 3.
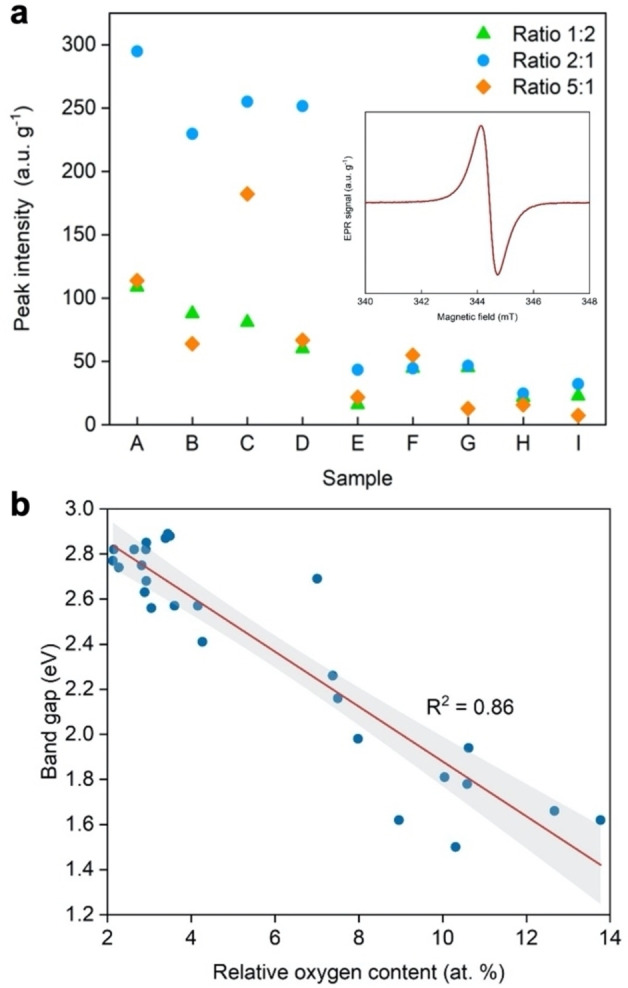
(a) Peak intensities derived from room temperature X‐band EPR spectra for all BNO samples investigated in this study (see Table S3 for sample names). Inset: Paramagnetic signature of the representative BNO sample obtained using X‐band EPR spectroscopy at 298 K with radical peak originating from isolated OB3 sites; (b) Scatter plot of the band gap against the oxygen content for all BNO samples investigated in this study. Least squares linear regression was applied to obtain the line of best fit (red) and the 95 % confidence intervals (grey shaded area). The coefficient of determination (R2) illustrating the goodness of the linear fit is shown in each plot.