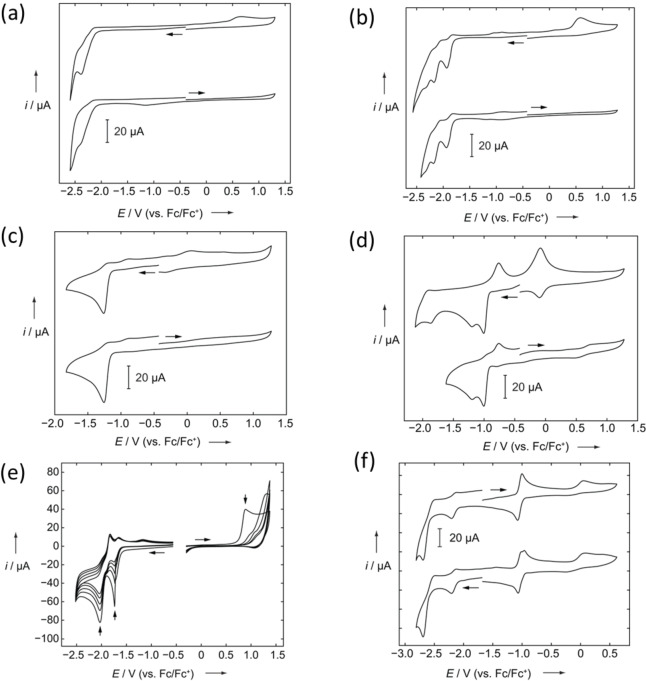
Figure 6.
Cyclic voltammograms of a) 1 and b) 2 in CH2Cl2/0.1 M [n‐Bu4N][PF6]; c) 1M and d) 2M in MeCN/0.1 M [n‐Bu4N][PF6]; e) multiple scans of 3 in CH2Cl2/0.1 M [n‐Bu4N][PF6] (vertical arrows show the decrease of peak size with repeated scans), f) 3M in DMF/0.1 M [n‐Bu4N][PF6]. A scan rate of 250 mV s−1 was applied for all the measurements.

