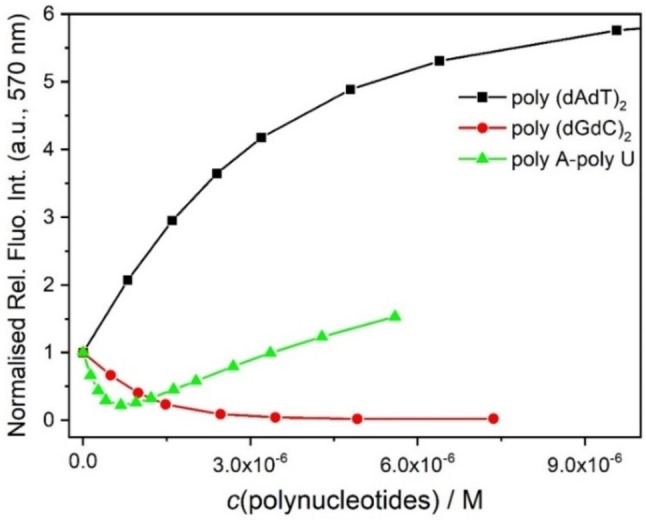
Figure 8.

Dependence of 3M (c=5×10⁻⁷ M, λ ex=500 nm) emission intensity at λ max=570 nm upon titration with poly(dAdT)2 (–), poly(dGdC)2 (–) and polyA‐poly U (–), at pH 7.0, sodium cacodylate buffer, I=0.05 M. Red line denotes non‐linear fitting of data to the Scatchard equation. [48]
