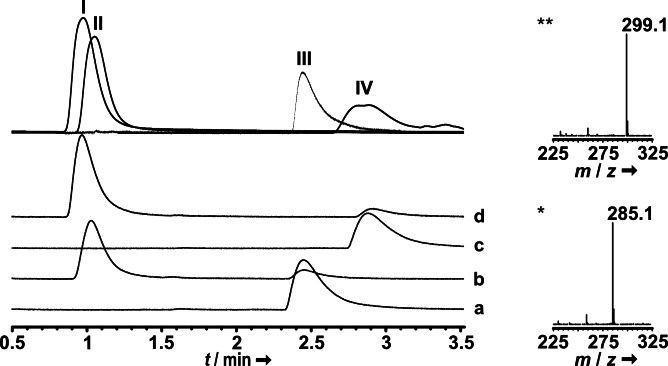
Figure 5.
LC–MS analysis of PsiK in vitro assays. Chromatograms were recorded at λ=280 nm. Top trace: authentic standards of aeruginascin (I), psilocybin (II), psilocin (III), and 4‐OH‐TMT (IV) are shown as an overlay of separate chromatograms. Trace a: negative control with psilocin and heat‐inactivated enzyme; trace b: reaction with psilocin and native PsiK; trace c: negative control with 4‐OH‐TMT and heat‐inactivated enzyme; trace d: reaction with 4‐OH‐TMT and native PsiK. Mass spectra of product peaks show aeruginascin (m/z 299.1 [M]+) and psilocybin (m/z 285.1 [M+H]+) formation, respectively.

