Figure 1.
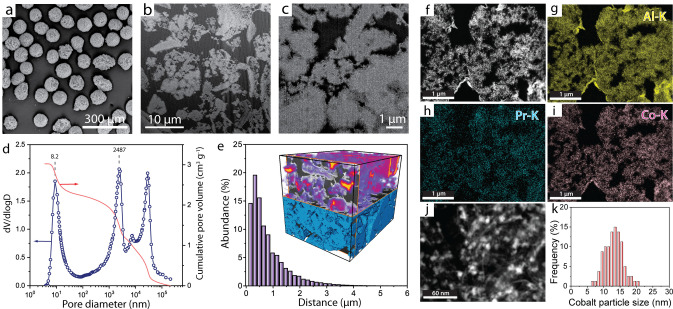
Structural characterization of an olefin‐selective cobalt Fischer–Tropsch catalyst (NaPr‐CoRu/AOmM). a) SEM image for catalyst microparticles. b), c) Cross‐sectional SEM images after Focused‐Ion‐Beam (FIB) milling of the resin‐embedded catalyst showing macropore opening cross‐sections (black regions) delimited by the γ‐Al2O3 backbone (light gray). d) Differential (blue scatter) and cumulative (red line) Hg intrusion pore size distributions. The contribution at >104 nm corresponds to voids between the catalyst microparticles. e) Histogram for the maximum transport distance through mesopore regions to the nearest boundary with the network of macropores as derived from 3D image analysis of the FIB‐SEM tomogram. The inset shows the 3D contour plot for the Euclidean distance to nearest macropore (top half) overimposed to the reconstructed tomogram (bottom half), with mesoporous Al2O3 domains displayed in blue. f) CS‐HAADF‐STEM image and g)–i) EDS analysis maps recorded at the Al‐, Pr‐ and Co‐K emission lines, respectively, on ultramicrotomed catalyst cross sections. Darkest regions (lowest Z‐contrast) correspond to the resin‐filled macropore openings. j) High‐magnification CS‐HAADF‐STEM image showing cobalt nanoparticles (brightest speckles with higher Z‐contrast) confined to the network of γ‐Al2O3 sheet‐like nanocrystallites. k) Cobalt particle size histogram.

