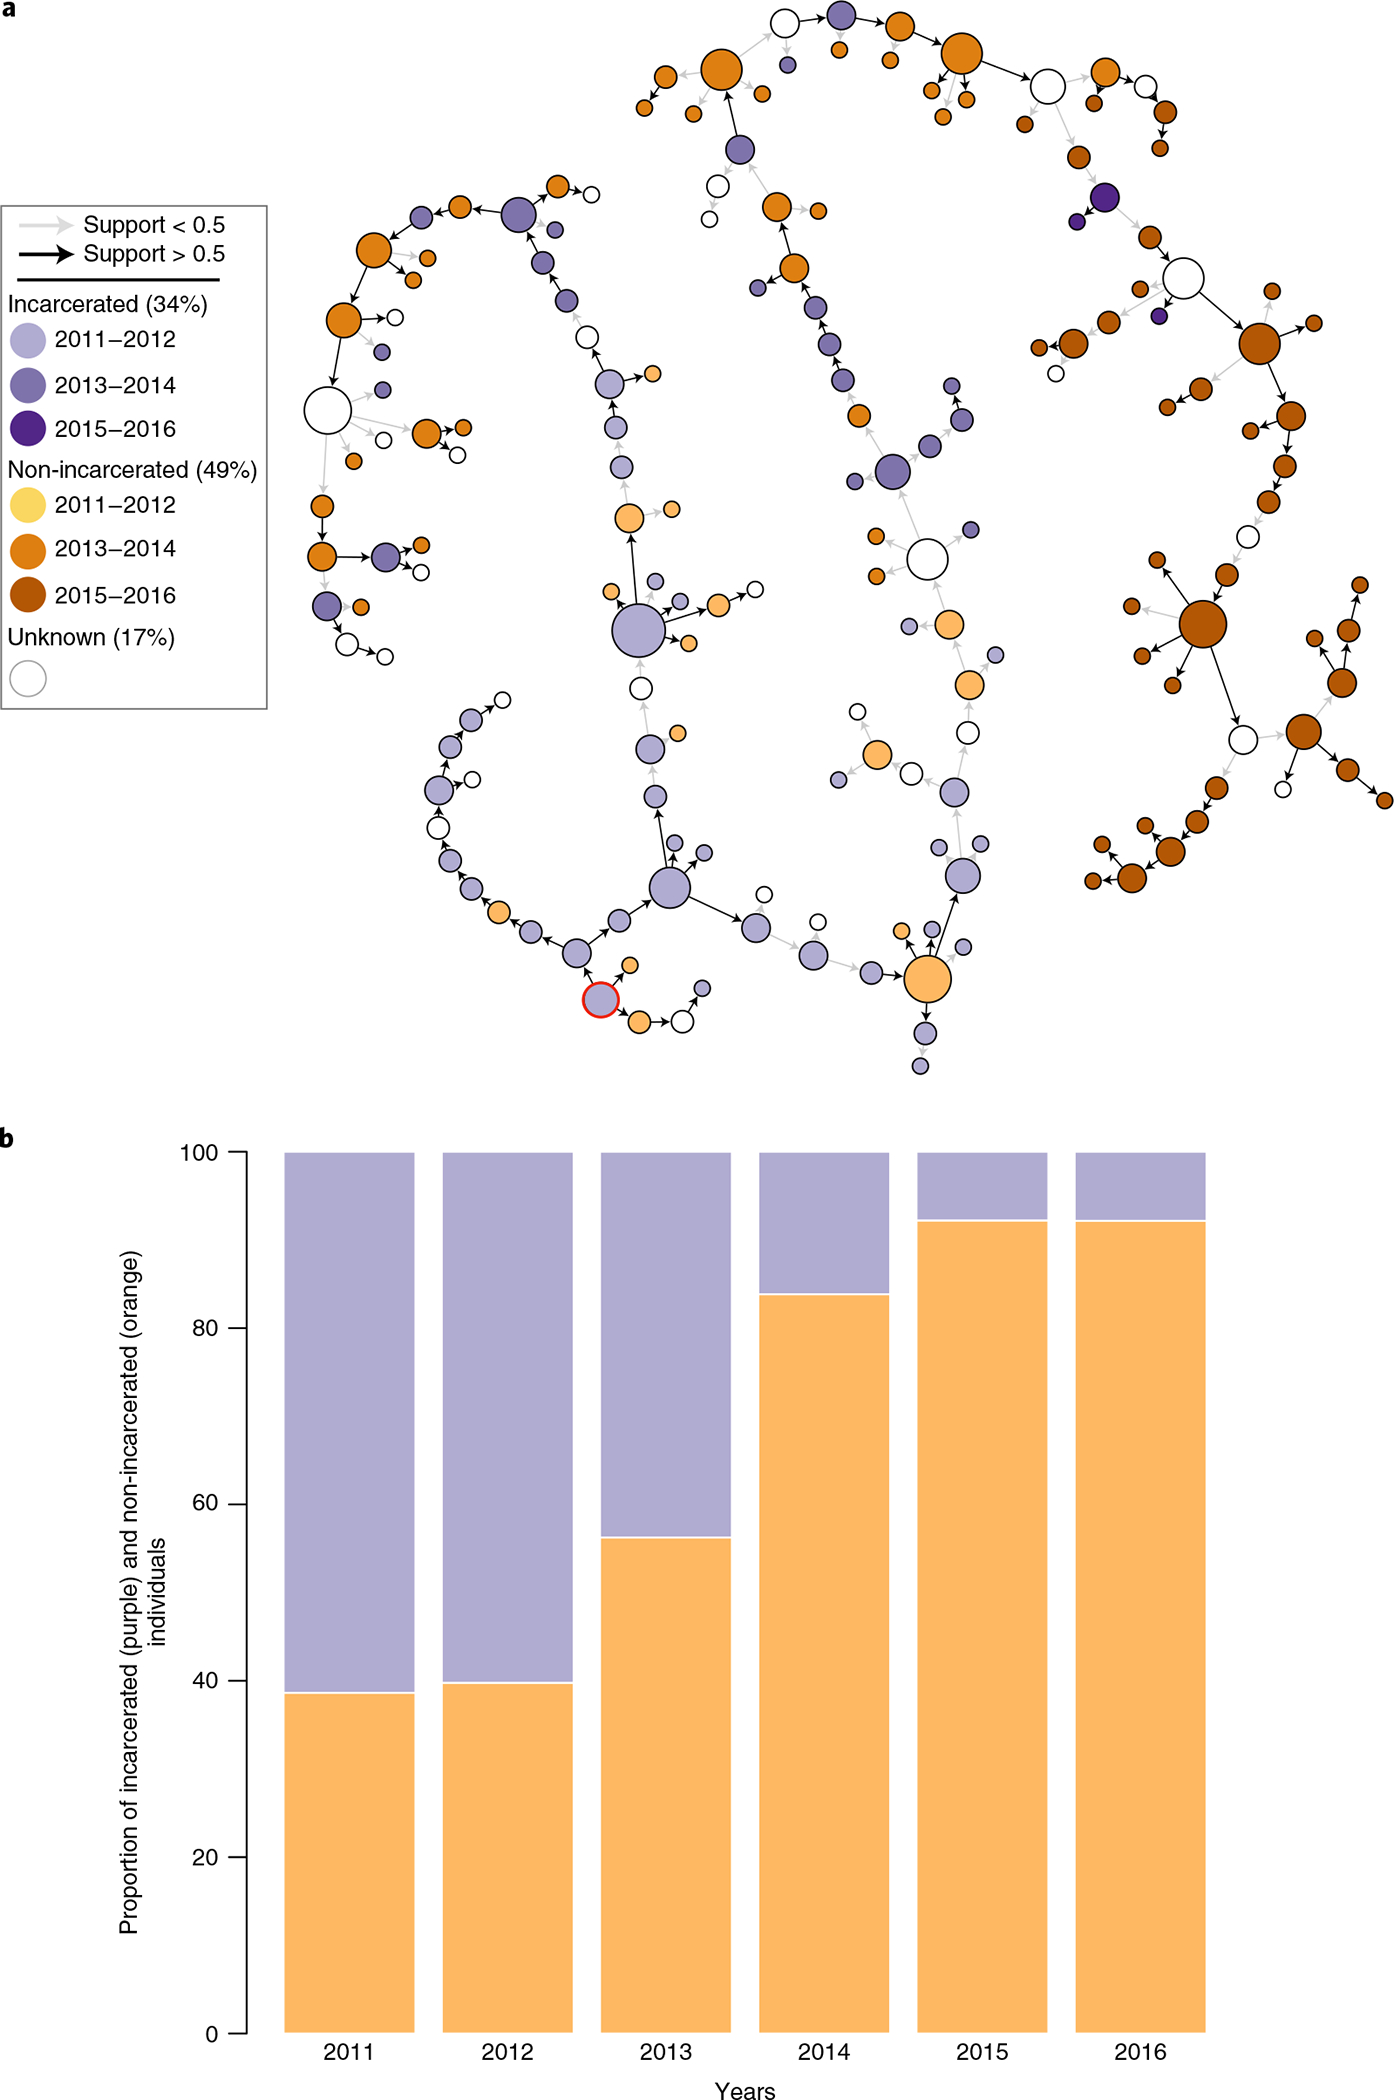
Fig. 3 |. Spill-over of MdR-TB from prisons into the general public.

a, Illustration of the transmission chain for the largest transmission cluster (n = 183). Isolates from incarcerated individuals have purple-colored nodes; isolates from non-incarcerated individuals have orange-colored nodes. Darker colors represent more recently sampled isolates. The most likely index case of the cluster is circled in red. Arrows indicate the directionality of the transmission events. High-confidence transmission events with probabilities >0.5 have a black arrow. b, Proportion of isolates from incarcerated and non-incarcerated individuals across the years in clusters containing at least one incarcerated individual. Orange represents non-incarcerated individuals; purple represents incarcerated individuals.
