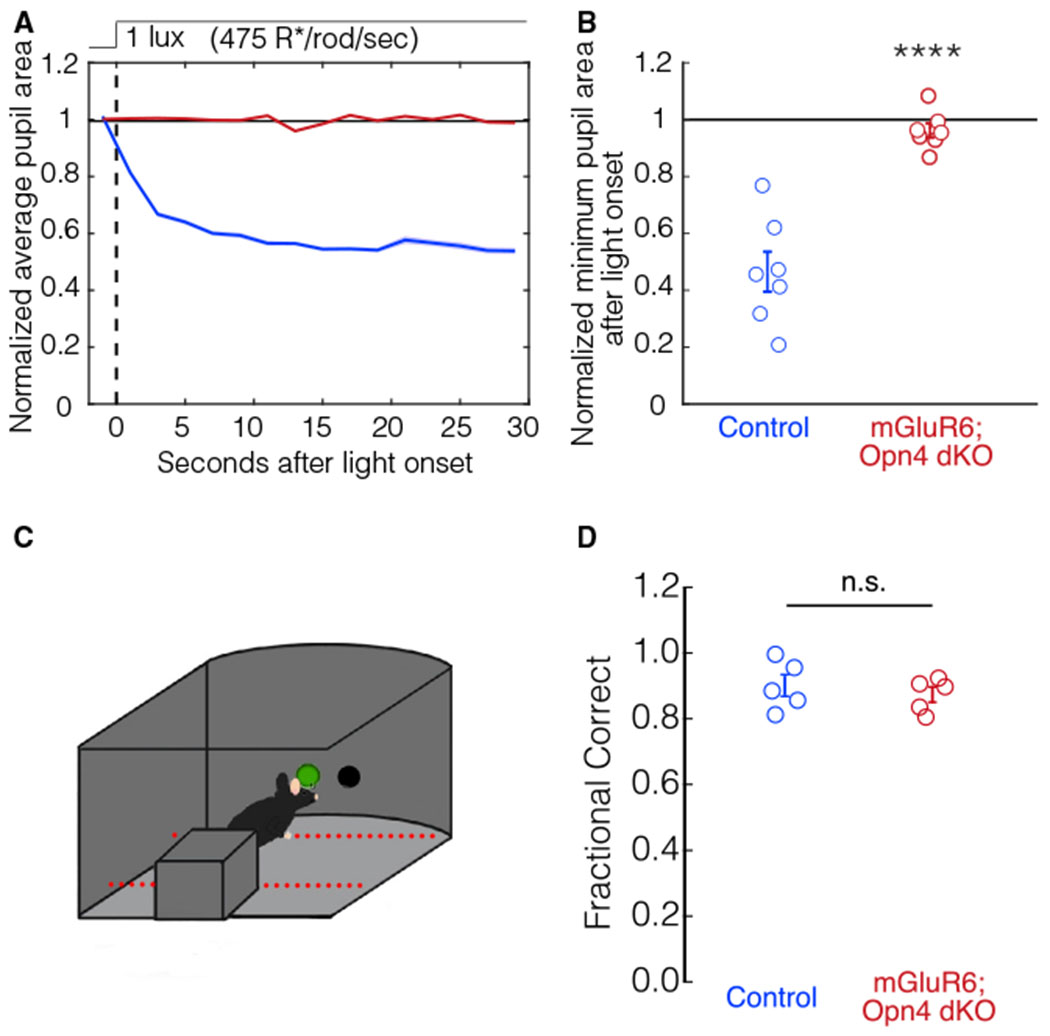
Figure 4. Rod OFF pathways drive scotopic image formation but do not drive the scotopic PLR.

(A) The average pupil constriction over time in response to 1-lux light (475 R*/rod/s) beginning at t = 0 s (dashed line) for control (blue, n = 7) and mGluR6; Opn4 dKO (dark red, n = 7) mice. Shaded outlines represent SEM. All pupil sizes are normalized to the dark-adapted pupil size (before t = 0).
(B) The minimum pupil area (maximal constriction) in response to 1-lux light from t = 0 to t = 30 s. Individuals and SEM are shown. Pupil constriction in littermate control mice and mGluR6; Opn4 dKO mice is significantly different (Student’s t test, p = 2E–5).
(C) Schematic depicting the visually guided behavioral task. Mice were dark adapted for 3 h before experiments, and the testing chamber was kept dark except for the scotopic light stimulus (200 R*/rod/s).
(D) Control mice (blue, n = 5) correctly detect the light stimulus in ~90% of the trials. mGluR6; Opn4 dKO mice (dark red, n = 5) correctly detect the light stimulus comparable with control mice under scotopic conditions (Student’s t test, p = 0.51). Error bars indicate SEM.
