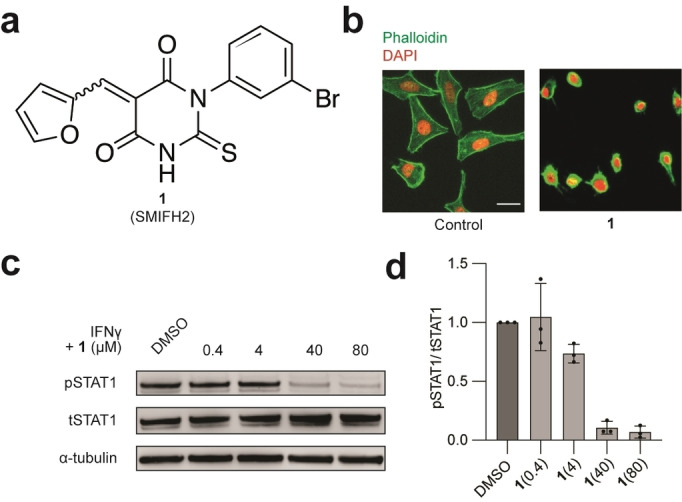
Figure 1.

a) Molecular structure of 1. b) Fluorescence microscopy images of HeLa cells treated with 1 (40 μM) for 20 min and stained with phalloidin and DAPI, Scale bar=30 μm. n=3 independent experiments. c) Immunoblot analysis of STAT1 phosphorylation in HeLa cells treated with IFNγ (1000 U mL−1, 20 min), that was preincubated with 1 for 20 min. d) Quantification of pSTAT1/tSTAT1 of the immunoblot in c. n=3 independent experiments.
