Figure 2.
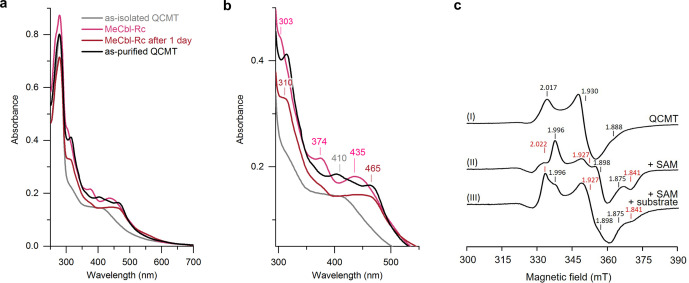
Characterization of QCMT‐bound cofactors by UV/Vis and EPR spectroscopy. a) UV/Vis absorption spectra of as‐isolated QCMT, QCMT reconstituted with MeCbl, MeCbl‐reconstituted QCMT after one day of storage and as‐purified QCMT. b) Same as in panel (a) with focus on the 300–550 nm region. Wavelengths of characteristic absorption features are indicated in corresponding color for as‐isolated QCMT (410 nm), MeCbl‐Rc QCMT (303, 374 and 435 nm) and MeCbl‐Rc QCMT after 1 day (310 and 465 nm). Absorption bands of as‐purified QCMT are at 314, 403 and 462 nm. c) EPR spectra at 13 K of dithionite‐reduced (5 mM) (I) as‐purified QCMT (200 μM), (II) as‐purified QCMT (200 μM) after addition of SAM (1 mM), and (III) as‐purified QCMT (200 μM) after addition of peptide substrate (300 μM) and SAM (1 mM). The g‐values of the individual signals are indicated. For spectra II and III, g(1)‐values are marked in red and g(2)‐values in black. Other EPR conditions: microwave power, 10 mW (non‐saturating), single scan.

